Binance Coin Rises Above The Critical $500 Mark Again

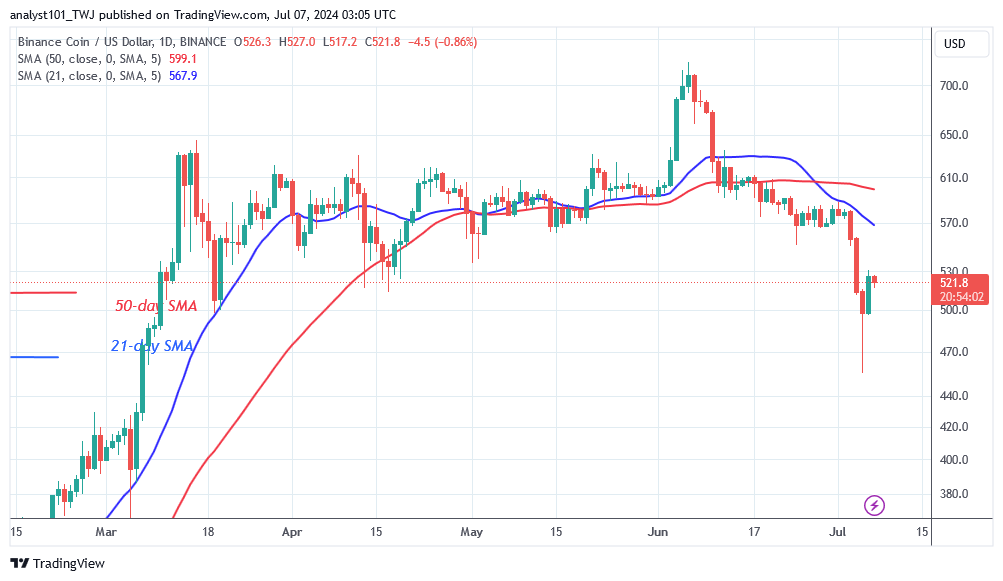
The latest price analysis by Coinidol.com report, Binance Coin (BNB) has fallen to a low of $454 before recovering above the $500 support.
BNB price long term forecast: bearish
Selling pressure has reached the historical price level of March 19, which is the $500 support. In previous price action, the altcoin fell to a low of $551 on June 24 before moving below the moving average lines. On July 1, the bulls failed to sustain the price above the 21-day SMA, leading to a further decline in the cryptocurrency. The bears broke through the current support at $551 and reached another low of $454. However, the bulls took advantage of the dips and rose above the $500 support. The $500 support is the historical price level from March 19, which has not yet been breached. After the previous decline, BNB is now correcting above the $500 level. The upward correction is meeting resistance at the 21-day SMA or the high of $551. BNB is now worth $520.
BNB indicator reading
The resistance line of the 21-day SMA has crossed below the 50-day SMA, signaling a downtrend. The horizontal moving average lines have now dipped downwards, through the trend. On July 5, the price of the cryptocurrency formed a long candlestick tail pointing below the $500 support. This indicates significant buying pressure at the $500 level.

Technical indicators:
Key resistance levels – $600, $650, $700
Key support levels – $400, $350, $300
What is the next direction for BNB/USD?
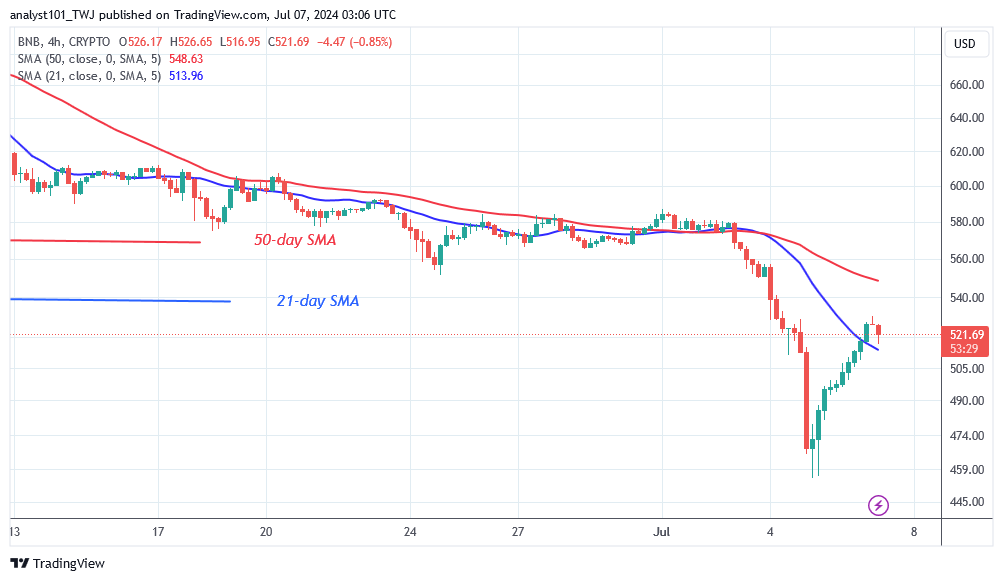
BNB has returned above the key $500 support, which has not been breached since March 19. On the 4-hour chart, BNB has corrected upwards and is now trading between the moving average lines. The altcoin could remain trapped between the moving average lines for a few more days. The upward movement will start when it breaks above the 50-day SMA or resistance at $560.

Disclaimer. This analysis and forecast are the personal opinions of the author and are not a recommendation to buy or sell cryptocurrency and should not be viewed as an endorsement by CoinIdol.com. Readers should do their research before investing in funds.
Price
Coin expert
Coin expert
Coin expert
Price

(0 comments)