Bitcoin Cash Retraces to Critical Support at $200 as Bears Renew Selling Pressure

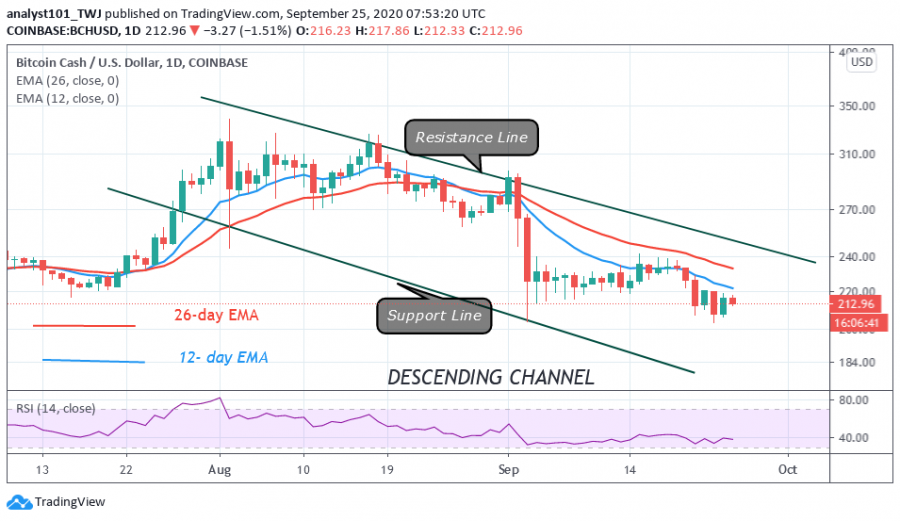
Bitcoin Cash (BCH) price analytics, September 25, 2020. BCH is fluctuating between $205 and $220 after the recent breakdown. The coin has been falling gradually to the critical support at $200.
Bitcoin Cash price Long-term Analysis: Bearish
On September 25, sellers are determined to sink BCH below the critical support, but buyers are contesting the current downtrend. Hence, the current price tussles between buyers and sellers at the bottom of the chart. Sellers are having the upper hand as the coin is in the bearish trend zone.
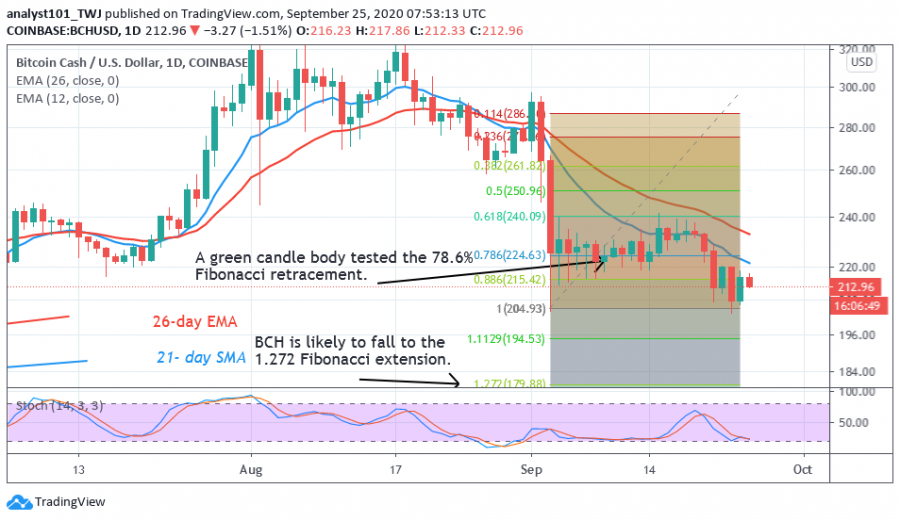
Assuming we have another breakdown below $205 and $200, BCH is likely to drop at $180. It will be surprising as the critical support at $200 has not been broken since March. Perhaps, the bulls will buy the dips when price retraces’ to the critical support level. This second price option took place on June 28 as the market rallied to $320 in August. Meanwhile, BCH is trading at $213 at the time of writing.
Bitcoin Cash Indicator Reading
As the market continues its downward move, the price bars are facing rejections at the 12-day EMA. The coin will continue to fall as long as the price is below the EMAs. The crypto is at level 38 of the Relative Strength Index period 14. The coin is in the downtrend zone and below the centerline 50.

Key Resistance Zones: $440, $480, $520
Key Support Zones: $200, $160, $120
What Is the Next Move for Bitcoin Cash (BCH)?
As the market continues to consolidate above $205, it is unclear if the critical support will hold or not. A strong bounce above the critical support will signal the resumption of the upward move. At the same time, it will invalidate the Fibonacci tool analysis, where the BCH will fall to the low at $180. In the absence of the above, the market will continue its consolidation above critical support.

Disclaimer. This analysis and forecast are the personal opinions of the author and not a recommendation to buy or sell cryptocurrency and should not be viewed as an endorsement by Coin Idol. Readers should do their own research before investing funds.
Coin expert
Price
Price
Coin expert
Price

(0 comments)