Weekly Cryptocurrency Market Analysis: Altcoins Are In Bullish Trend Zones While Facing Overhead Barrier Levels

The cryptocurrencies in question are trading in a positive trend zone.
Buyers are struggling to maintain bullish momentum above overhead resistance levels, which is a problem. We will briefly talk about a few of the alternative coins.
ssv.network
The price of ssv.network (SSV) is steadily rising. The price of the cryptocurrency is experiencing a series of higher highs and higher lows. The value of the cryptocurrency asset rose to a high of $49.99 before the decline. The price of the altcoin has climbed into the overbought territory of the market. When the altcoin fell back to its low of $45, sellers emerged. Further upward movement of the altcoin is unlikely as the market approaches the overbought area of the market.SSV is trading in an overbought area. The Relative Strength Index for period 14 is 76.The following characteristics describe SSV, the cryptocurrency that is currently the best performer.

Current price: $45.07
Market capitalization: $495,435,649
Trading volume: $78,279,685
7-day gain/loss: 37.50
NEM
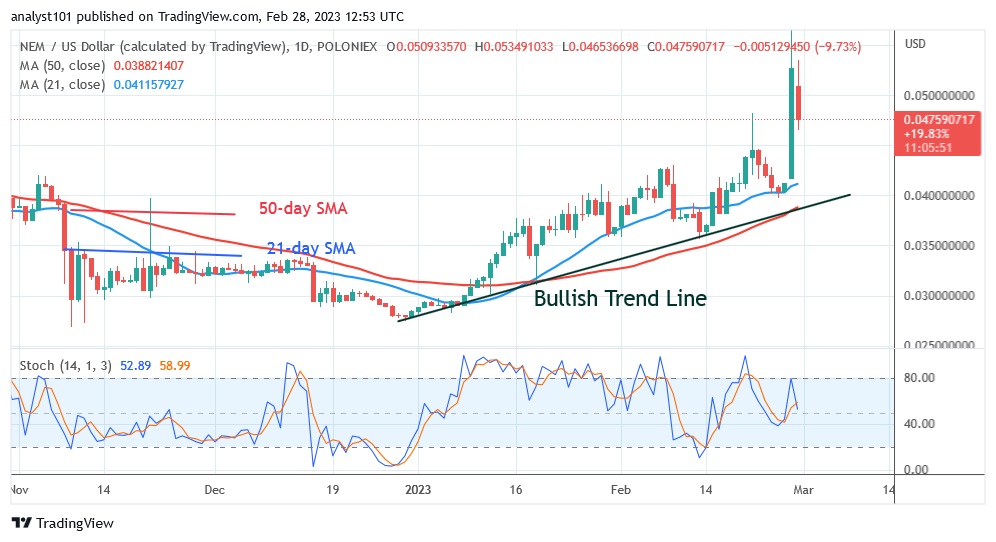
NEM (XEM) is in an uptrend. Crossing the moving average lines, the altcoin recovered above the support level of $0.027. The cryptocurrency's value rose to a high of $0.056 before declining. Today, the altcoin is moving near the moving average lines again. If the price of the cryptocurrency finds support above the moving average lines, XEM will start a new rise. On the other hand, the current rally will come to an end if the cryptocurrency's price falls below the moving average lines. Below the 80 level of the daily stochastic, XEM has negative momentum. Among all cryptocurrencies, the altcoin had the second best performance this week. The cryptocurrency's characteristics include:

Current price: $0.05307
Market capitalization: $477,603,141
Trading volume: $424,717,845
7-day gain/loss: 25.12%
Stacks
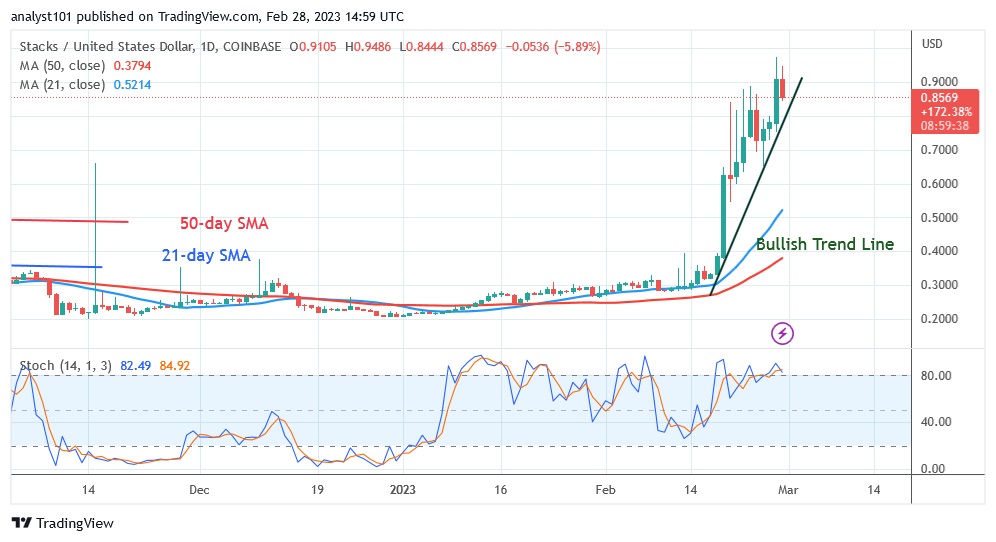
Stacks (STX) has risen to a high of $0.90 and is currently trading in the bullish trend zone. Since the low of $0.85, the cryptocurrency asset has been in a slight retracement. If the price retracement rises above the $0.70 support, the uptrend will continue. The cryptocurrency will rise to a high of $1.20 if the current resistance of $0.90 is broken. Nevertheless, the altcoin market is now overbought. Therefore, the current rally has reached bullish exhaustion. With a value of 80 on the daily stochastic, STX is currently in the overbought zone. STX is the third best performing cryptocurrency. It has the following characteristics:

Current price: $0.915
Market capitalization: $1,662,941,221
Trading volume: $348,263,425
7-day gain/loss: 24.83
Lido DAO
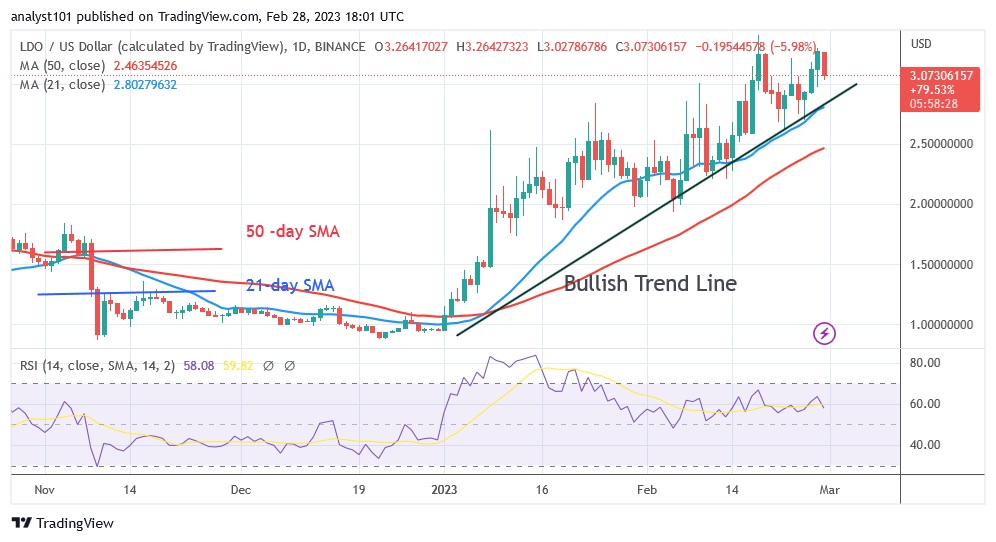
The price of Lido DAO (LDO) is on the rise. The crypto asset's value reached a high of $3.40 but failed to maintain the strong trend. Before falling, buyers tested the resistance level twice. The altcoin is currently trading in a limited band between $3.00 and $3.40. If the price breaks above the $3.40 resistance level, the uptrend will resume. The uptrend will continue to the high at $4.40. On the other hand, the downtrend will resume if LDO declines and falls below the 21-day line SMA. LDO is currently trading at the 57 level of the period 14 Relative Strength Index. The altcoin could rise in the bullish trend zone. LDO is the fourth best performing cryptocurrency.

Current price: $3.07
Market capitalization: $3,066,643,855
Trading volume: $237,273,355
7-day gain/loss: 10.89%
Optimism
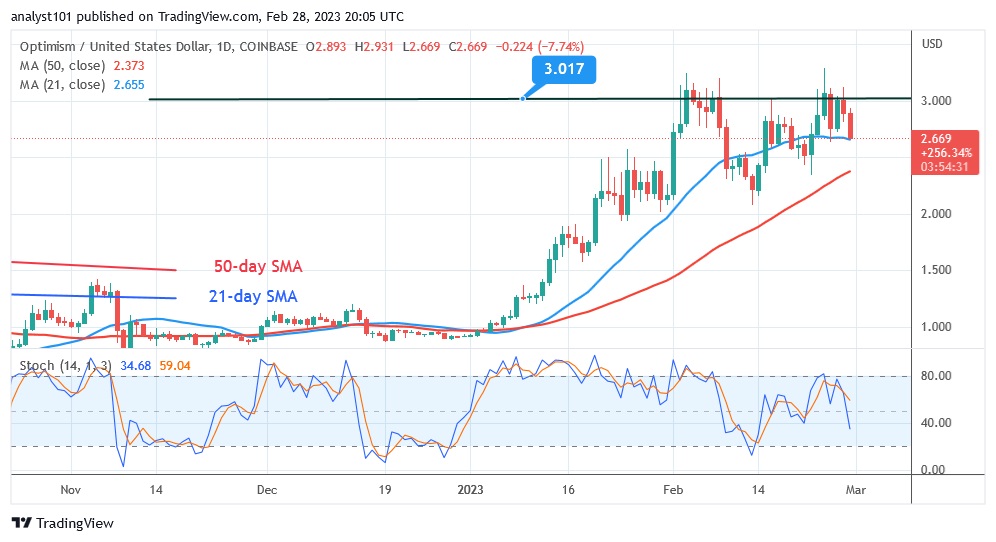
The price of Optimism (OP) is currently in the bullish trend zone. The cryptocurrency asset is struggling to maintain its position above the moving average. The resistance level of $3.00 has been a resistance point since February 2. After the previous rejection, the cryptocurrency is currently falling. On the downside, OP will be trapped between the moving average lines if the cryptocurrency price falls below the 21-day line SMA. When the price drops below the moving average lines, the decline will resume. The altcoin will fall to its previous low of $1.50. When the daily stochastic is below 40, OP is in a bearish momentum. OP is the name of the fifth best cryptocurrency. It has the following characteristics:

Current price: $2.70
Market capitalization: $11.544.946.579
Trading volume: $308,614,533
7-day gain/loss: 10.51%
Disclaimer. This analysis and forecast are the personal opinions of the author and are not a recommendation to buy or sell cryptocurrency and should not be viewed as an endorsement by CoinIdol. Readers should do their research before investing in funds.
Price
Price
Price
Business
Price

(0 comments)