Weekly Analysis of the Cryptocurrency Market: Altcoins Consolidate as They Revisit the Bottom Price Levels
Updated: Nov 21, 2022 at 13:05

Сryptocurrencies are trading at the bottom of the chart, in the downtrend zone. The coins are under heavy selling pressure as they fall to their own lowest price levels. One advantage of the negative trend is that buyers are attracted to the lower price levels.
Casper
Casper (CSPR) has fallen significantly to a low of $0.026 and is currently in a downtrend. The historical price level of August 28 represents the current low. After reaching a high of $0.055, the altcoin fell below the $0.050 resistance. Casper fell below the moving average lines after a bearish double top formed. Bearish exhaustion was reached on the descent.
For the period 14, the cryptocurrency is at the level 32 of the Relative Strength Index. The oversold area of the market for the altcoin has been reached. The probability of additional selling pressure is low, as buyers are expected to advance to the oversold area of the market. The cryptocurrency has had the worst weekly performance with the following characteristics:
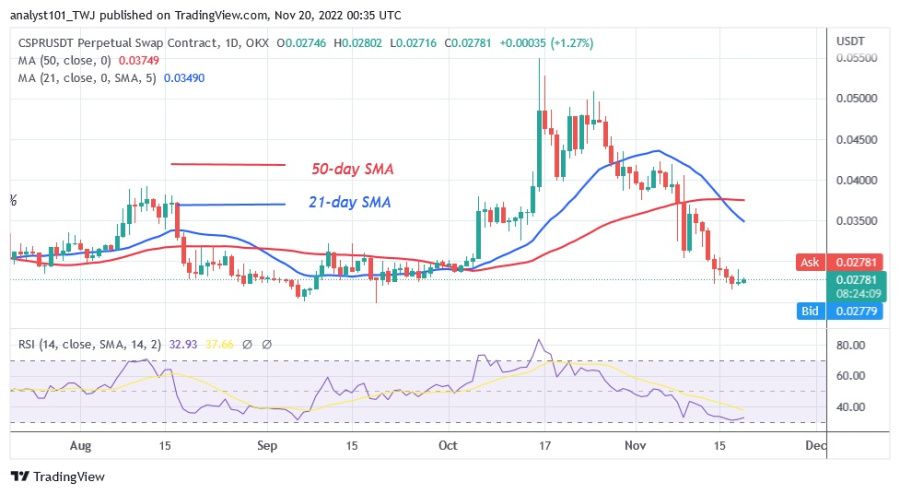
Price: $0.02791
Market capitalization: $313,253,581
Trading volume: $6,733,391
7-day loss: 17.14%
Solana
Solana (SOL) fell sharply to a low of $11.57 in a downtrend. The altcoin increased its correction upwards to a high of $18, but then selling pressure returned. The last low at $11.57 is being retested or undercut by sellers. The cryptocurrency price has fallen back below the 50-day line SMA. The altcoin has crossed the area between the moving average lines.
As sellers break below the moving average lines, Solana is trending down. The moving average lines have been significantly breached by the cryptocurrency. Solana is below the 20 level of the daily stochastic and has entered the oversold zone. Solana has the second worst performance of the week. It has the following characteristics:
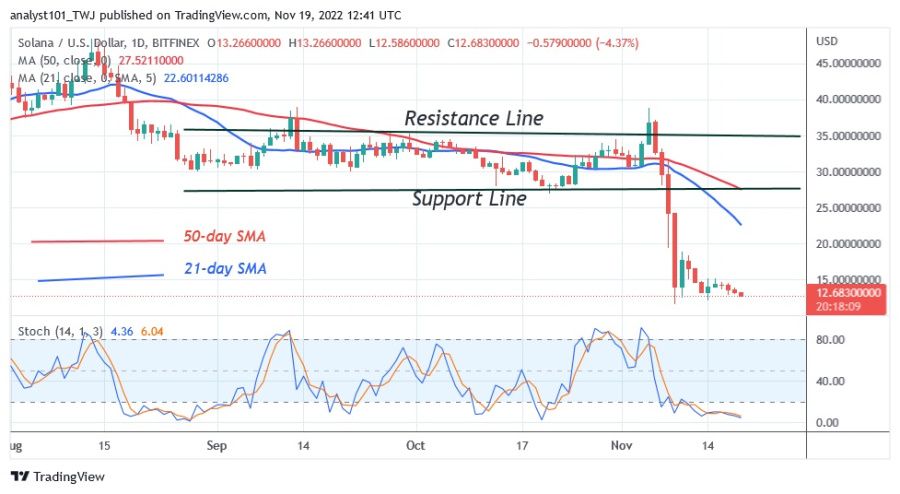
Price: $12.83
Market capitalization: $6,837,071,484
Trading volume: $343,863,228
7-day loss: 16.03%
NEAR Protocol
The price of Near Protocol (NEAR) is in a downtrend, falling to a low of $1.70. With the cryptocurrency trading in oversold territory, the downtrend has reached bearish exhaustion. The high at $3.30 has been rejected by the current decline. On the weekly chart, NEAR has completed an upward correction and the candlestick has tried to reach the 78.6% Fibonacci retracement line. NEAR will fall to the level of the 1.272 Fibonacci extension or $1.37. It is below the level 20 of the daily stochastic and has entered the oversold zone of the market. The altcoin has shown the third worst performance in the past week. It has the following characteristics:
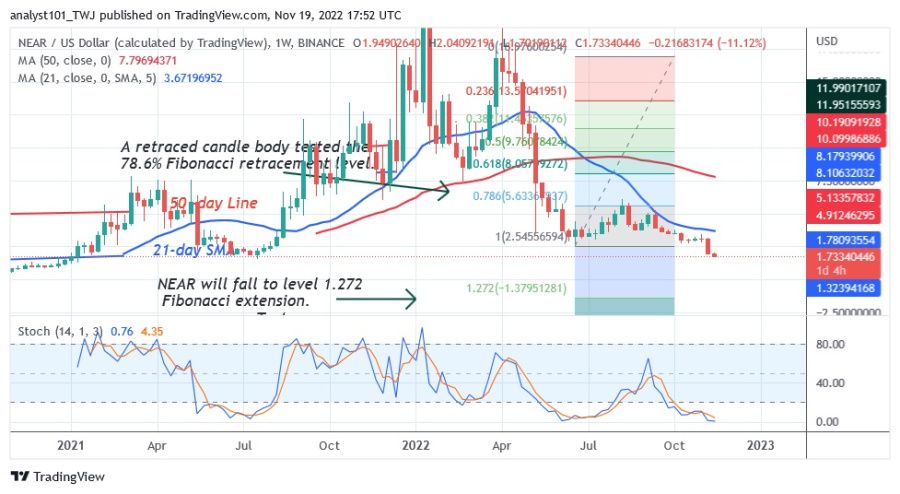
Price: $1.74
Market capitalization: $1,735,983,660
Trading volume: $105,454,628
7-day loss: 14.48%
Huobi Token
Huobi Token (HT) is currently in a downtrend due to the breakdown of the altcoin below its moving average lines. The cryptocurrency's price dropped below $3.75 before recovering. The altcoin has fallen and is now challenging the price level of August 19 in the past.
Prior to the August price recovery, altcoin had consolidated above recent support for several weeks. HT is at level 26 of period 14 of the Relative Strength Index. The market oversold and is now there. The fourth worst weekly performance belongs to HT. The characteristics of the cryptocurrency include:
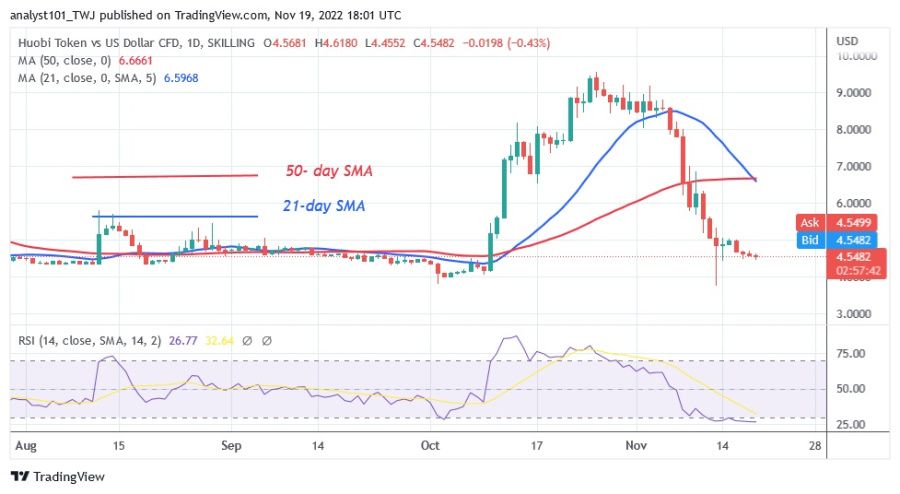
Price: $4.55
Market capitalization: $2,273,380,917
Trading volume: $2,273,380,917
7-day loss: 12.97%
Curve DAO Token
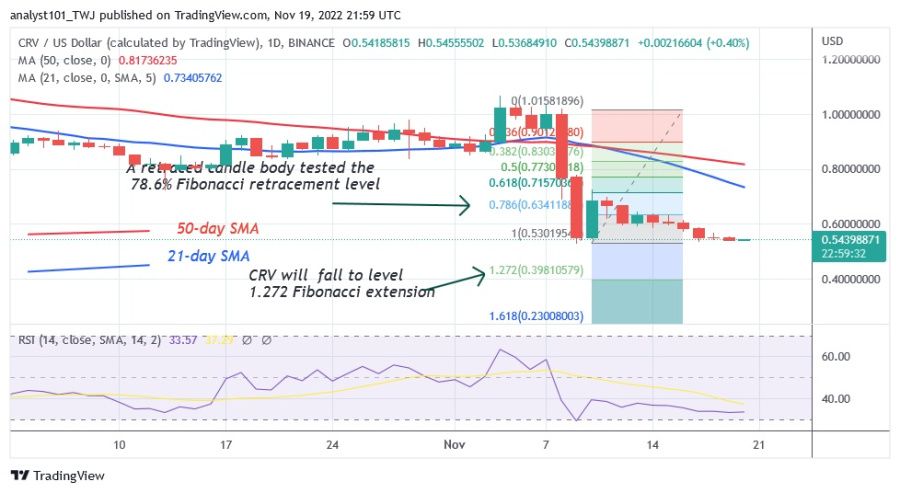
Curve DAO Token (CRV), which is in a downtrend, drops to a low of $0.54. The high of $1.00 was discarded by the current decline. The altcoin performed an upward correction and reached a high of $1.06. The decline is due to the fact that buyers were not able to maintain the positive momentum.
CRV is now trading in the oversold zone of the market. CRV experienced an upward correction during the November 9 decline while a candlestick tested the 78.6% retracement level. The correction predicts that CRV will decline but turn around the 1.272 Fibonacci level or $0.39. The Relative Strength Index for the period 14 places the altcoin at the 33 level, approaching the oversold area of the market. These are some characteristics of Curve DAO Token:
Price: $0.5422
Market capitalization: $1,792,334,141
Trading volume: $26,715,684
7-day loss: 12.64%
Disclaimer. This analysis and forecast are the personal opinions of the author and are not a recommendation to buy or sell cryptocurrency and should not be viewed as an endorsement by Coin Idol. Readers should do their own research before investing in funds.
Price
News
Price
News
Price

(0 comments)