XRP Consolidates On Reaching Critical Support At $0.50
Updated: Oct 09, 2024 at 11:04

The price of Ripple (XRP) has dipped below the moving average lines as the altcoin maintains its sideways trend.
XRP long term analysis: bearish
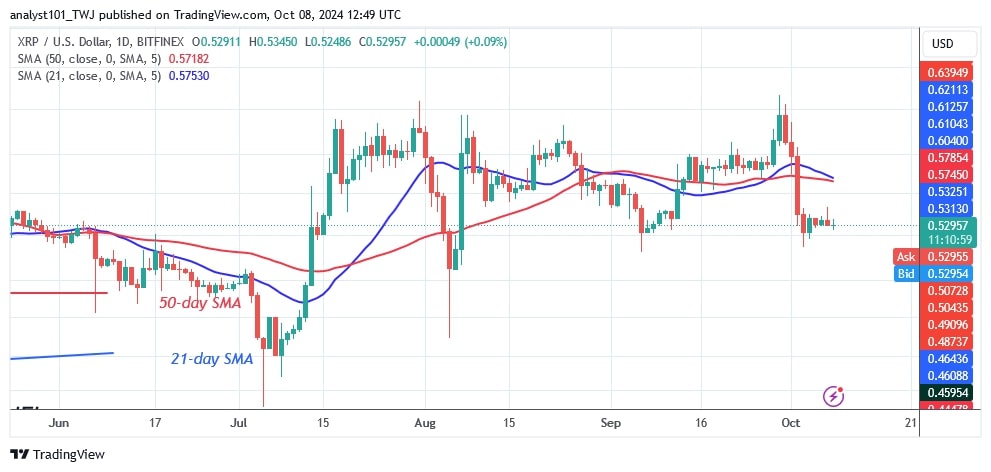
On October 3, XRP fell below the moving average lines and hit a low of $0.50 before resuming consolidation above the current support. On the negative side, further declines in XRP appear unlikely. The altcoin had been in reverse for two months when it reached critical support at $0.50.
Since October 3, the price action has been stationary due to the formation of doji candlesticks. If the current support holds, the cryptocurrency will rise in value. The altcoin is trading above the $0.50 support but below the moving average lines. The price of the altcoin will increase if it rises and breaks above the moving average lines.
XRP indicator analysis
The moving average lines have remained horizontal since July 17, as reported by Coinidol.com. After the recent drop, the price bars are now below the moving average lines. Doji candlesticks have reappeared as the cryptocurrency consolidates above its current support. When the doji candlesticks materialize, the selling pressure will most likely end.
Technical indicators:
Resistance Levels – $0.80 and $1.00
Support Levels – $0.40 and $0.20

What is the next direction for XRP?
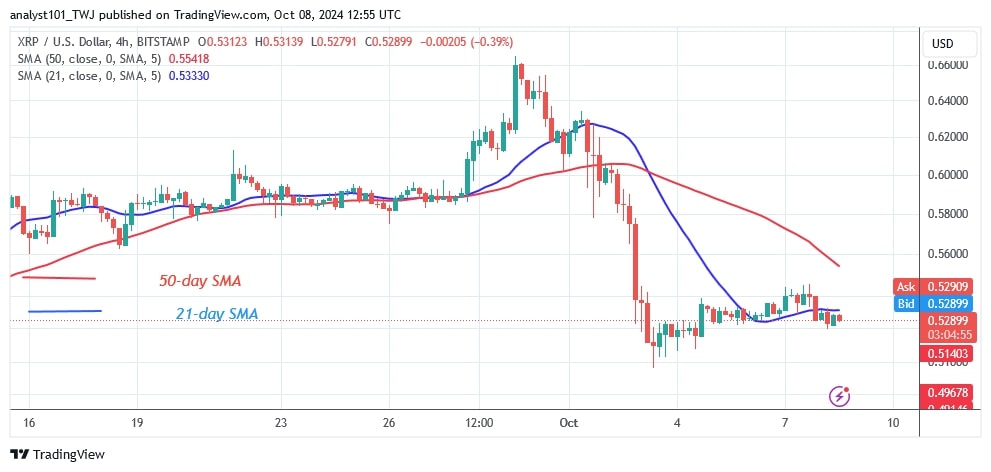
On the 4-hour chart, XRP is trading sideways as it consolidates above the $0.50 support. The price of the cryptocurrency is oscillating above the $0.50 support level but below the moving average lines. The uptrend will resume once the price breaks above the moving average lines. In the meantime, the altcoin is trading in a bearish trend zone.

Disclaimer. This analysis and forecast are the personal opinions of the author and are not a recommendation to buy or sell cryptocurrency and should not be viewed as an endorsement by CoinIdol.com. Readers should do their research before investing in funds.
Price
Price
Price
Price
News

(0 comments)