Ripple Reaches Target Price Level of $0.30 but Fails to Sustain Upturn
Updated: Nov 19, 2020 at 14:30

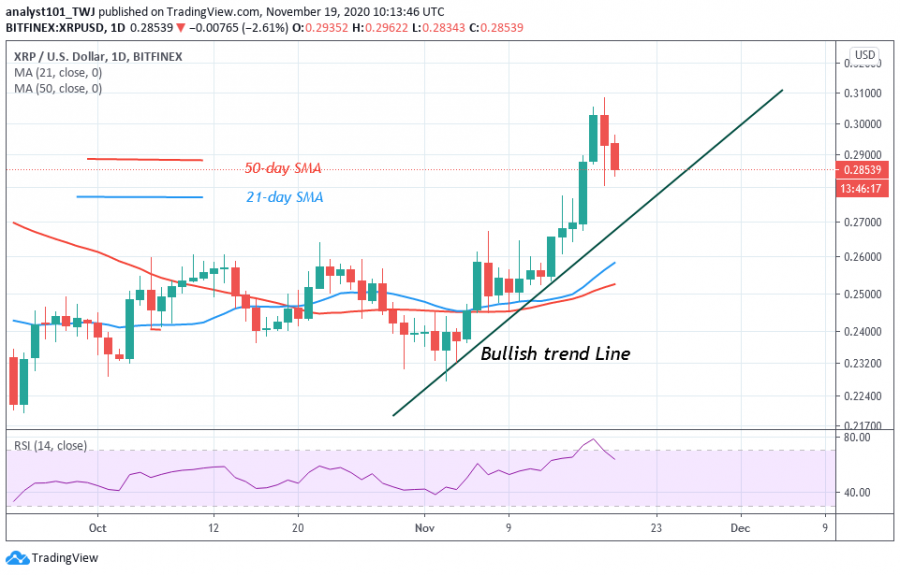
Ripple (XRP) price analysis, November 19, 2020. For the past week, Ripple has been making positive moves up to November 17 when it reached a high of $0.305.
Ripple (XRP) Price Long-Term Forecast: Bearish
Buyers reached their target price at the recent high but could not sustain the uptrend to the previous highs. In the first uptrend, XRP was resisted but the coin retraced to retest the resistance the following day.
On November 18, the bulls broke the resistance level as price rose to a $0.308 high. Consequently, the crypto was repelled as the coin plunged to a $0.282 low. Buyers made concerted efforts to push the XRP upward but face another rejection twice at the $0.295 high. XRP is now trading at $0.286 at the time of writing. The altcoin will continue to fall if it falls below the $0.27 support. However, if the current support holds, the bearish scenario will be invalidated.
Ripple (XRP) Indicator Analysis
Ripple is retracing after rejection from the $0.305 high. The selling pressure will persist if the price retraces and breaks below the bullish trend line. The price has also broken the 21-day SMA and if it breaks below the second moving average, it will be in the bearish trend zone.

Key Resistance Zones: $0.35, $0.40, $0.45
Key Support Zones: $0.25, $0.20, $0.15
What Is the Next Move for Ripple (XRP)?
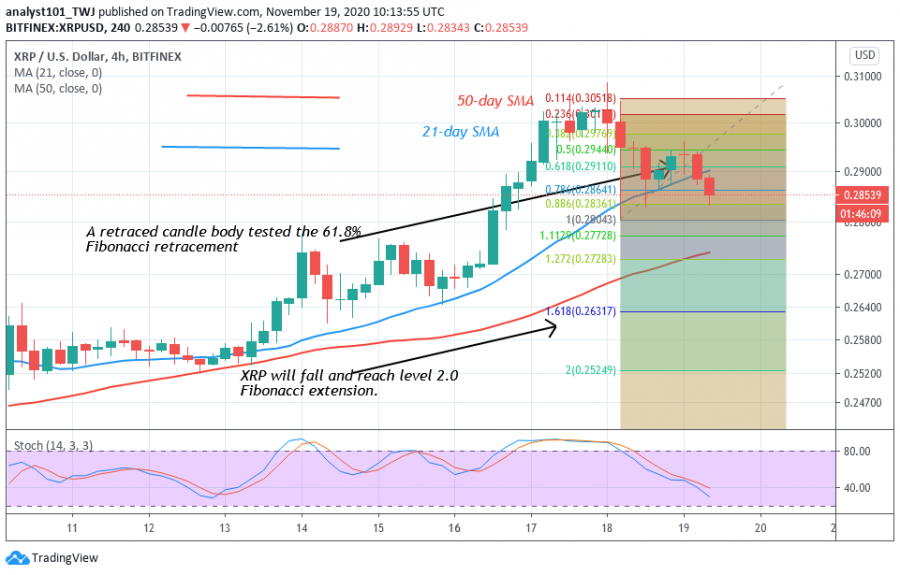
Ripple is falling as the bears attempt to push XRP to the previous low. From the downtrend of November 18, the price corrected upward. The retraced candle body tested the 61.8% Fibonacci retracement level. This retracement indicates that Ripple is likely to fall to the low at level 1.618 Fibonacci extension. That is the coin will fall to a $0.263 low.

Disclaimer. This analysis and forecast are the personal opinions of the author and not a recommendation to buy or sell cryptocurrency and should not be viewed as an endorsement by CoinIdol. Readers should do their own research before investing funds.
Price
News
Price
Price
Price

(0 comments)