Weekly Cryptocurrency Market Analysis: Altcoins Try To Continue Their Recovery

Cryptocurrencies are correcting upwards after an early dip into the downtrend zone. The upward correction is being held back by a lack of demand for higher prices. Under certain circumstances, altcoins get stuck between the moving average lines.
VeChain
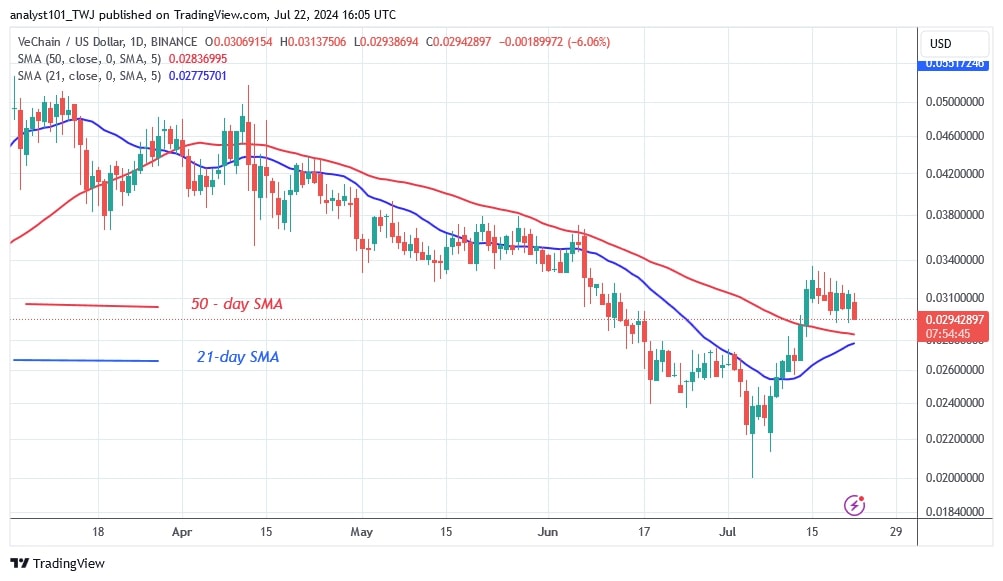
VeChain (VET) is in a downtrend but is making an upward correction. The bullish momentum broke above the moving average lines and reached a high of $0.033. As the price retraced above the moving average lines, the uptrend ended at its last high. VET will rise to $0.038 if the current resistance is broken.
However, if the bears break the moving average lines, the altcoin will fall to its previous low of $0.022. The altcoin is currently worth $0.028.VET is the worst performing altcoin. It has the following characteristics:
Current price: $0.02876
Market capitalization: $2,493,664,468
Trading volume: $34,293,617
7-day loss percentage: 9.15%
Aave
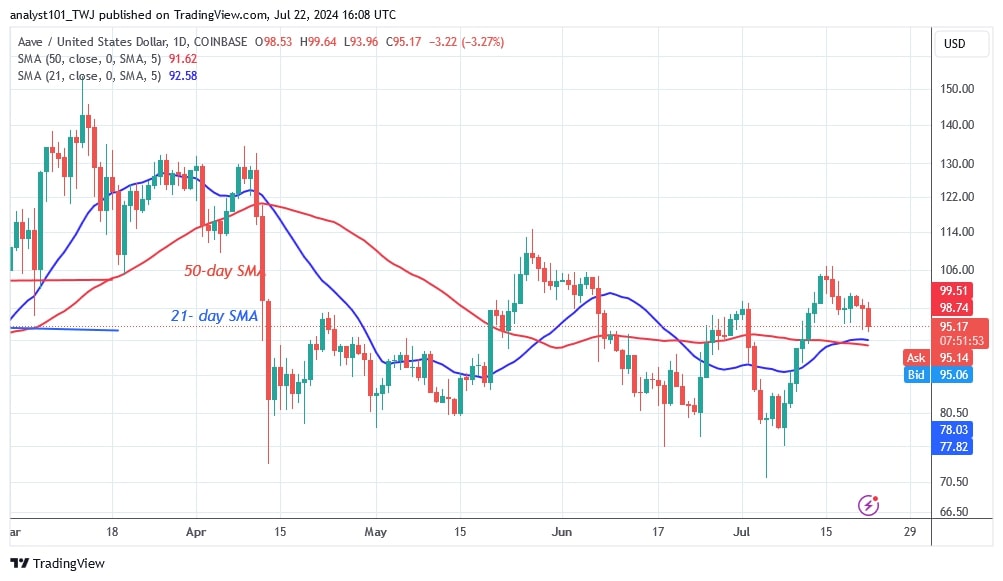
The price of Aave (AAVE) has been in a horizontal trend since the price dip on April 13. The cryptocurrency has been trading between $80 and $110. The altcoin is trading above the moving average lines but below the resistance level of $110. On the upside, if the bulls break the resistance at $110, AAVE will reach a high of $130.
Meanwhile, the price of the cryptocurrency oscillates above the moving average lines. AAVE is the cryptocurrency with the second worst performance. AAVE is the cryptocurrency with the second-lowest performance. It has the following characteristics:
The current price: $94.22
Market capitalization: $1,507,536,219
Trading volume: $98,876,464
7-day loss percentage: 6.94%
Maker
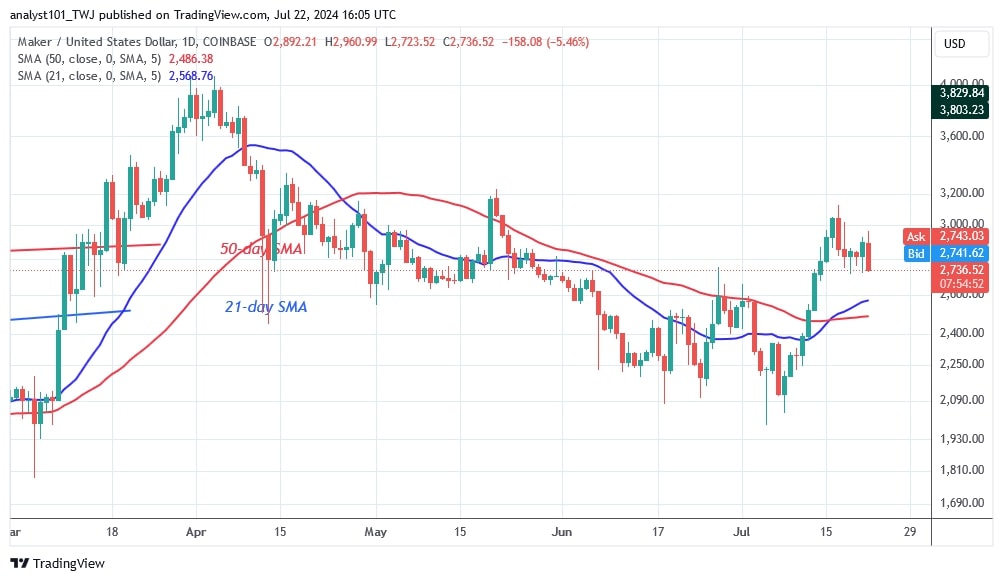
The price of Maker (MKR) is correcting upwards while it is in a downtrend. The price of the cryptocurrency rises above the moving average lines and reaches a high of $3,125. Buyers were unable to sustain the bullish momentum above the barrier at $3,000, leading to rejection. The altcoin has retraced above the moving average lines but is still finding support above them. The altcoin could resume its uptrend if it consolidates above the moving average lines.
However, since April 16, the upward movement has been halted at the $3,200 resistance level. MKR is moving in a range between $2,000 and $3,200 price levels. MKR is the third worst performing cryptocurrency based on these metrics.
The current price: $2,770.06
Market Capitalization: $2,785,775,586
Trading Volume: $125,239,691
7–day Loss: 5.40%
Notcoin
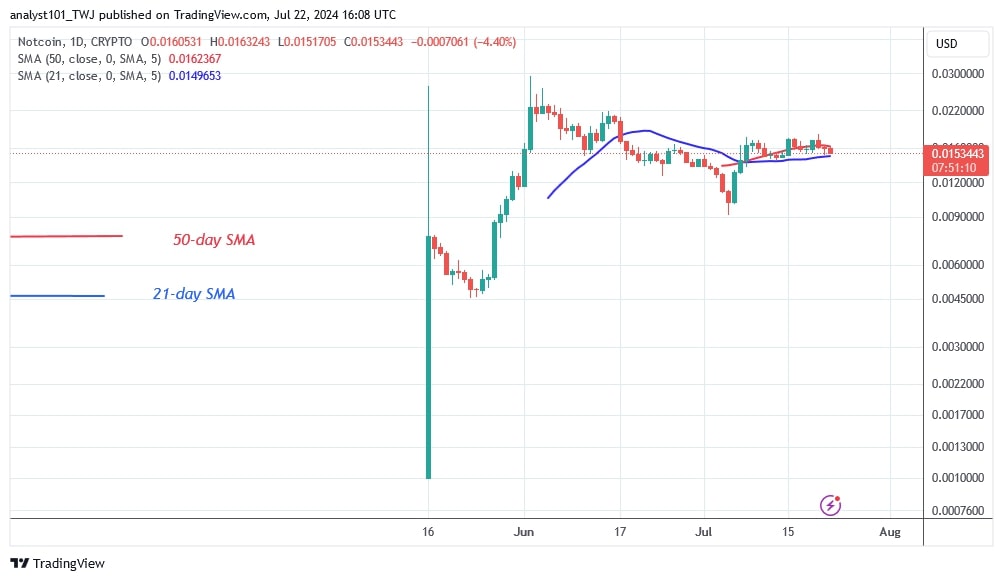
Notcoin (NOT) is currently in an uptrend, but has entered a sideways trend after reaching resistance at $0.029. Since the end of the upswing on June 2, the sideways trend has continued. The price range of the altcoin is between $0.009 and $0.02. If the range is broken, the altcoin will show a trend.
NOT is rising and striving to break out above the moving average lines. NOT is worth $0.014 at the time of writing. In the meantime, the price action has remained stationary and is dominated by doji candles. This is the fourth worst performing cryptocurrency. Here are a few critical components.
The current price: $0.01421
Market Capitalization: $1,456,569,717
Trading Volume: $211,492,822
7–day Loss: 4.55%
Ethereum Name Service
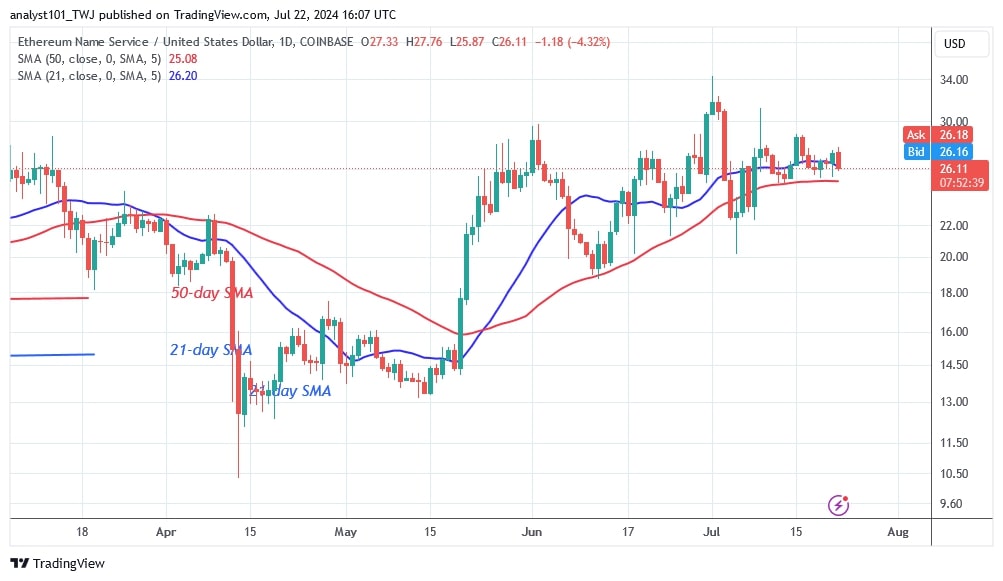
The price of Ethereum Name Service (ENS) has begun a horizontal trend after stalling at a high of $30 on June 1. ENS is currently trading below the upper resistance of $30. Every time the altcoin attempts to break through the $30 overhead resistance level, it falls below the moving average lines.
Now, ENS is trading above the 21-day SMA but below its recent high. The altcoin is now valued at $28.45. It is the fifth worst performing cryptocurrency. It has the following characteristics:
The current price: $28.71
Market Capitalization: $2,870,671,446
Trading Volume: $451,155,746
7–day Loss: 4.41 %
Disclaimer. This analysis and forecast are the personal opinions of the author and are not a recommendation to buy or sell cryptocurrency and should not be viewed as an endorsement by CoinIdol.com. Readers should do their research before investing in funds.
Price
News
Price
Price
News

(0 comments)