TRON Risks Further Decline As It Is Rejected At $0.14
Updated: Mar 09, 2024 at 11:07

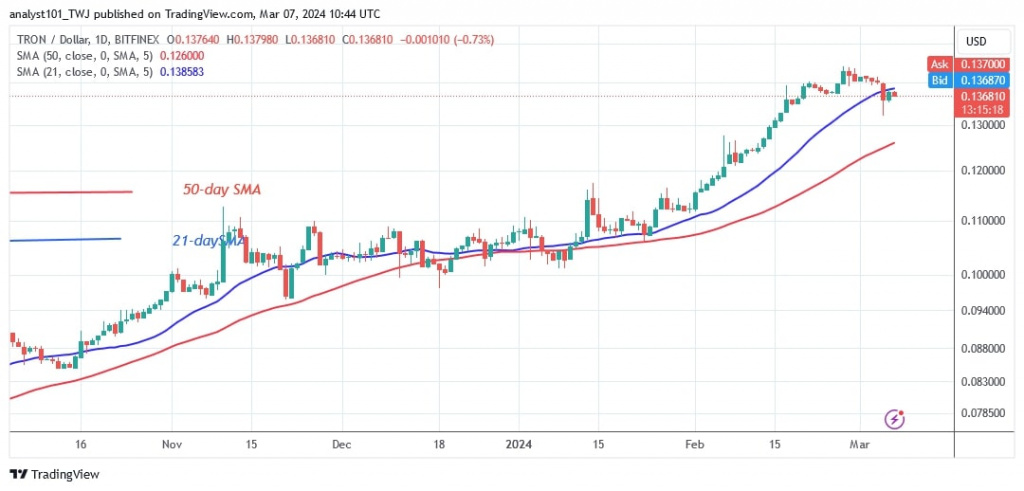
The price of TRON (TRX) falls below the 21-day SMA after being rejected at the high of $0.1440. TRON price analysis by Coinidol.com.
Long-term forecast for TRON price: bullish
TRON has been in a downtrend since February 28 as it has been unable to break through the $0.1440 resistance level. The cryptocurrency has fallen below the 21-day SMA. The 21-day SMA and the resistance at $0.14 have halted the uptrend.
On the downside, TRON is likely to drop to a low above the 50-day SMA or the support at $0.125. If the bears manage to break below the moving average lines, the selling pressure could continue. TRON will continue to fall and reach a low of $0.12. At this point, the altcoin is worth $0.136.
TRON indicator reading
TRON price bars have broken below the 21-day moving average line but remain above the 50-day SMA. The cryptocurrency value will trade between the moving average lines until the cryptocurrency resumes its trend. TRON will perform when the moving average lines are broken.
Technical indicators
Key supply zones: $0.09, $0.10, $0.11
Key demand zones: $0.06, $0.05, $0.04

What is the next direction for TRON?
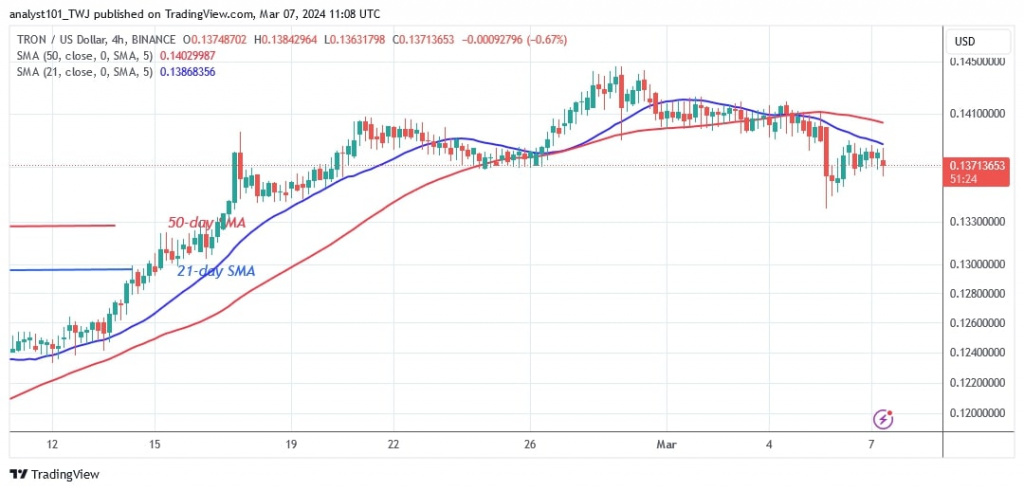
On the 4-hour chart, TRON has fallen below the moving average lines. The altcoin fell to a low of $0.134 before recovering. The altcoin is likely to return to a price range of $0.134 to $0.14. The current downturn has eased and the altcoin is between the moving average lines.

Disclaimer. This analysis and forecast are the personal opinions of the author and are not a recommendation to buy or sell cryptocurrency and should not be viewed as an endorsement by CoinIdol.com. Readers should do their research before investing in funds.
Price
Price
News
Price
Price

(0 comments)