TRON Rises Again But Faces The $0.155 Barrier
Updated: Sep 09, 2024 at 11:01

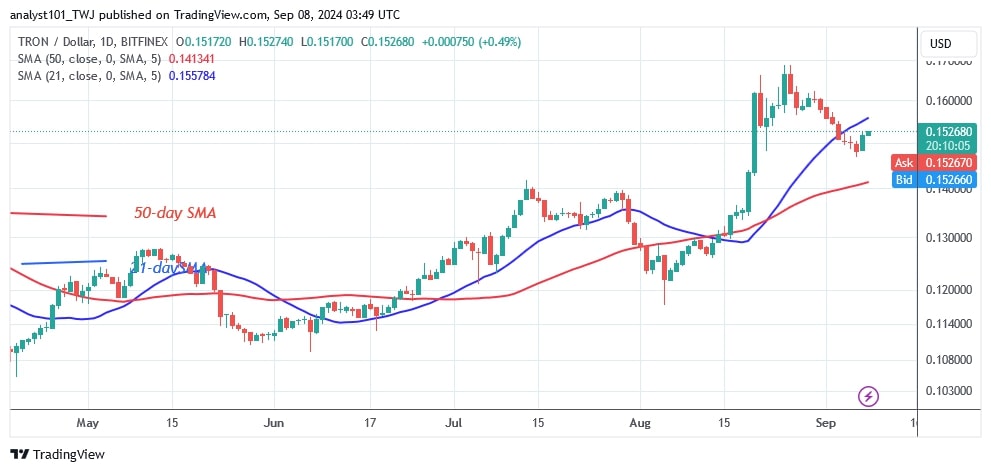
The price of TRON (TRX) fell below the 21-day moving average, triggering a move between the moving average lines.
Long-term forecast for TRON price: bullish
On August 25, as reported by Coinidol.com, the previous trend got stuck at the $0.17 barrier. The price of the cryptocurrency was rejected twice by this resistance before falling below the 21-day SMA. TRON is currently trapped between the moving average lines.
Today, TRON resumed its bullish momentum as it approached the 21-day SMA resistance level. Should the bulls break above the 21-day SMA resistance, TRON will resume its uptrend. The altcoin will rise to a high of $0.17.
However, if the $0.17 level is breached, the altcoin will continue to rise. If the buyers fail to sustain the price above the 21-day SMA, the altcoin will be forced to trade in a narrow range for a few days. In the meantime, TRON's value stands at $0.152.
TRX indicator reading
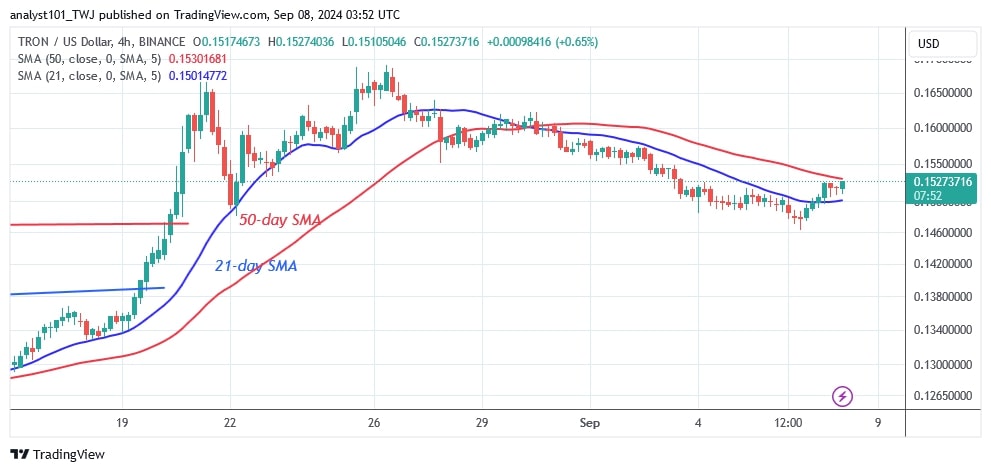
TRON is located between the moving average lines after the end of the last trend. Breaking through the moving average lines determines whether it is an upward or downward movement.
On the 4-hours chart, the price bars are located between the moving average lines. However, the price bars are marked by doji candlesticks.
Technical Indicators
Key Supply Zones: $0.13, $0.14, $0.15
Key Demand zones: $0.10, $0.09, $0.08

What is the next move for TRON?
TRON has regained momentum, although the altcoin remains trapped between the moving average lines. The Doji candle will influence the upward or downward movement of the price. The candlesticks represent traders' indifference to the direction of the market.

Disclaimer. This analysis and forecast are the personal opinions of the author. They are not a recommendation to buy or sell cryptocurrency and should not be viewed as an endorsement by CoinIdol.com. Readers should do their research before investing in funds.
Price
News
Price
Price
Price

(0 comments)