TRON Overcomes The $0.144 Level And Continues Uptrend

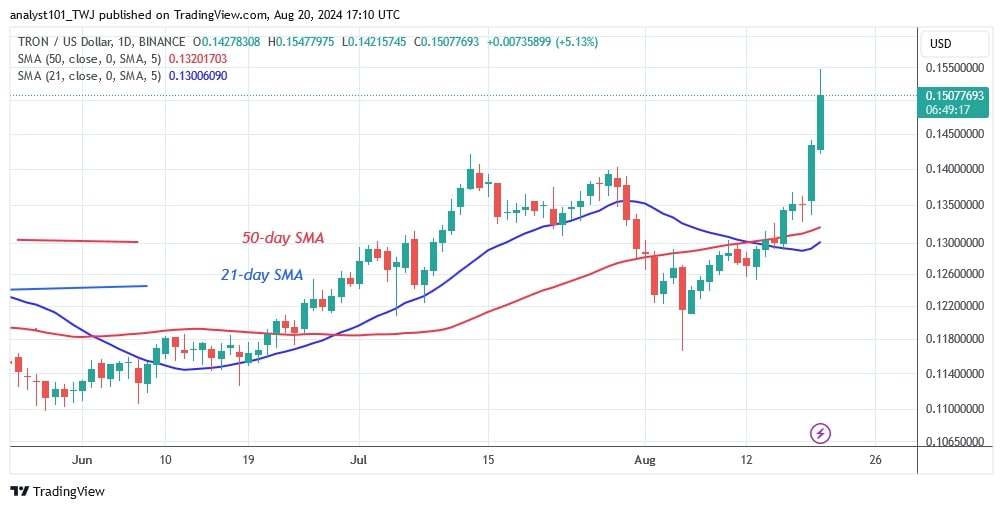
The price of TRON (TRX) has regained momentum and overcame the $0.144 resistance level.
On February 26, the price of the cryptocurrency peaked at $0.144. In recent months, buyers have not been able to maintain the upward momentum above the $0.144 barrier. The barrier at $0.144 forced the altcoin to trade in a range.
TRX price long-term prediction: bullish
On August 19, the above resistance was broken and TRON started its upward movement. TRON's price signal indicates a further upward movement.
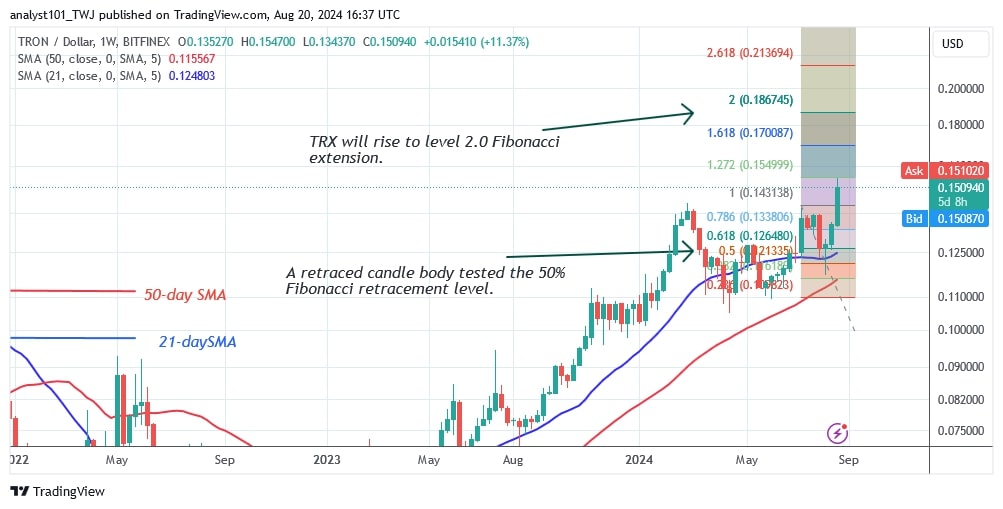
TRON's price signal has shown a further upward movement. During the rise on July 8, a retraced candle body approached the 50% Fibonacci retracement line. The retracement suggests that the price will continue to rise until it reaches the high of the Fibonacci extension of $ 2.0 or $0.186. The altcoin is worth $0.159 at the time of writing.
TRON indicator reading
On August 14, the price bars of the daily chart returned above the moving average lines. The horizontal moving average lines are sloping upwards, indicating an uptrend.
Technical Indicators
Key Supply Zones: $0.13, $0.14, $0.15
Key Demand zones: $0.10, $0.09, $0.08

What is the next move for TRON?
TRON's sideways trend has been broken and the bulls have broken through the overhead resistance at $0.144. Since July 13, the altcoin has traded in a range of $0.11 to $0.14. Today, the bulls broke through the price range and continued the cryptocurrency's uptrend. On the upside, TRON is predicted to reach the highs of $0.18 to $0.20.

Disclaimer. This analysis and forecast are the personal opinions of the author. They are not a recommendation to buy or sell cryptocurrency and should not be viewed as an endorsement by CoinIdol.com. Readers should do their research before investing in funds.
News
Price
News
Price
Price

(0 comments)