TRON Fails At The $0.21 Threshold

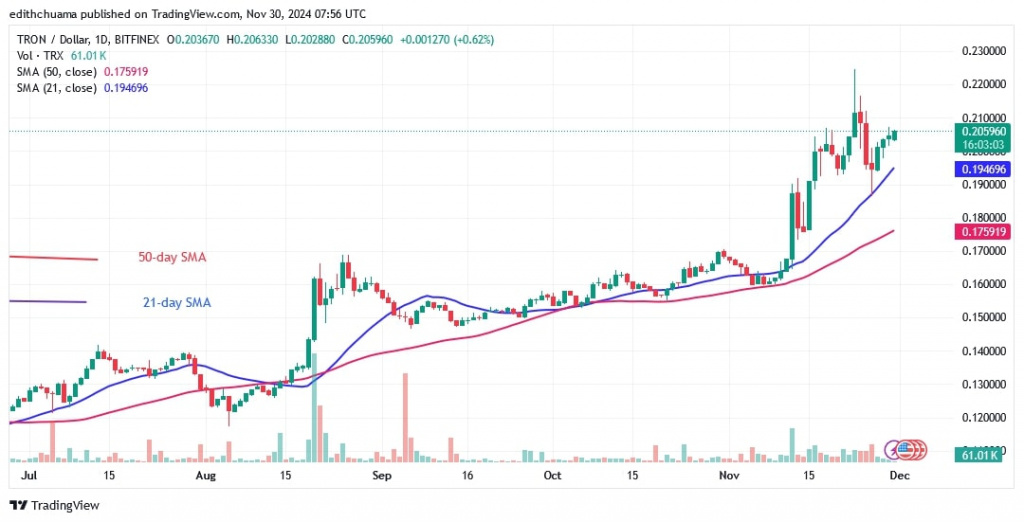
TRON (TRX) has made a series of higher highs and higher lows since breaking through the barrier at $0.18.
TRON price long-term forecasts: bullish
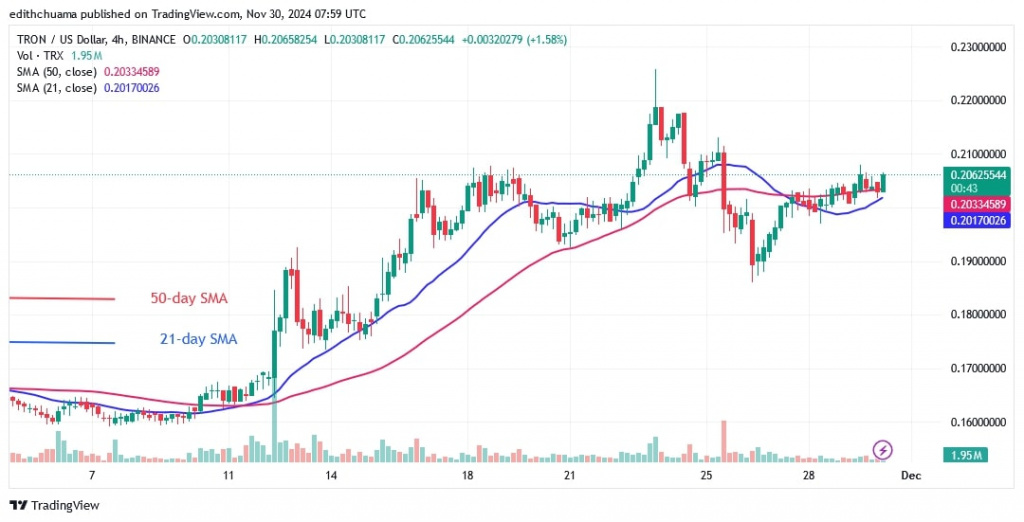
After the breakout, the bears planned to push the price below the $0.18 breakout level, but the bulls bought the dips. The bullish momentum broke through the hurdles and reached a high of $0.224. The altcoin fell below the low of $0.21 but continues to rise above the 21-day SMA support.
However, the altcoin will continue to trade above the moving average lines but below the barrier at $0.22 if it is rejected at the recent high. Currently, TRON is valued at $0.20.
TRON indicator analysis
TRON has pulled back after its last rejection above the 21-day SMA. On November 26, a long candlestick tail pointed to the 21-day SMA before retracing. After the comeback, TRON has resumed its uptrend. On the downside, the trend would be over if the bears fall below the moving averages.
Technical Indicators
Key Resistance Zones: $0.20, $0.22, and $0.24
Key Support Zones: $0.16, $0.14, and $0.12

What's next for TRON?
TRON has maintained a sideways trend and is trading above the $0.19 support and below the $0.21 resistance. Doji candlesticks have formed, so the price action below the $0.21 resistance remains static. The doji candlesticks with their small bodies and uncertain behavior have restricted the price movement.

Disclaimer. This analysis and forecast are the personal opinions of the author. They are not a recommendation to buy or sell cryptocurrency and should not be viewed as an endorsement by CoinIdol.com. Readers should do their research before investing in funds.
News
Price
News
Price
Price

(0 comments)