Toncoin Stabilizes And Continues To Rise Above $5.20

The price of Toncoin (TON) is recovering from its fall below the moving average lines.
Toncoin price long term forecast: bullish
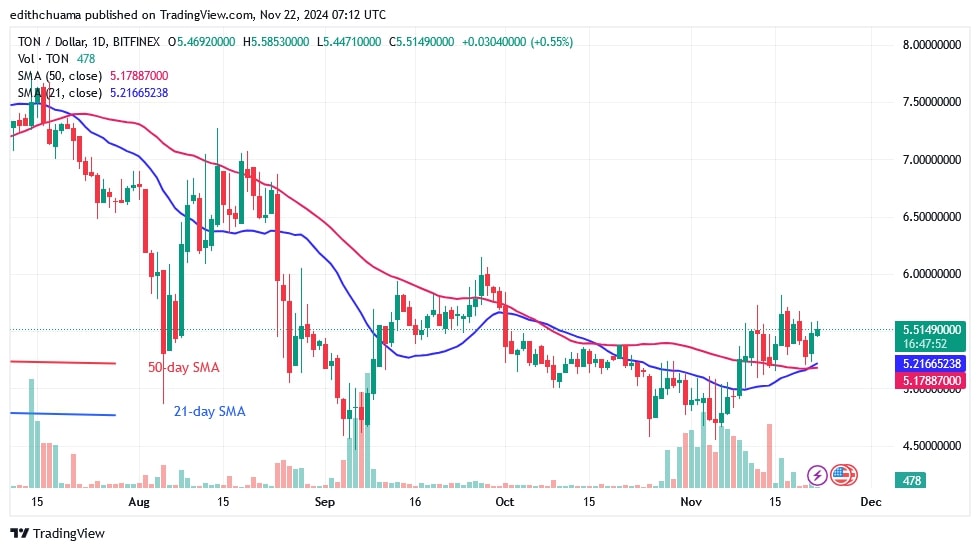
On November 5, TON fell beyond the critical support level of $4.50, but the bulls bought the dips, as Coinidol.com wrote. The upside momentum on Nov. 5 pushed the altcoin above the moving average lines TON has the potential to rise above the moving average line.
However, the upward movement was halted three times at the $6.00 resistance level. Last week, the altcoin traded above its moving average lines, indicating a positive trend.
TON indicator analysis
The price bars are consolidating above the moving average lines. The 21-day SMA is higher than the 50-day SMA, indicating a potential rise in the cryptocurrency. The downward sloping moving average lines are sloping upwards, indicating bullish momentum. However, the moving average lines on the shorter time frame are horizontal, indicating a sideways trend.
Technical Indicators
Resistance Levels: $6.00, $8.00, $10.00
Support Levels: $5.00, $3.00, $1.00

What is the next move for Toncoin?
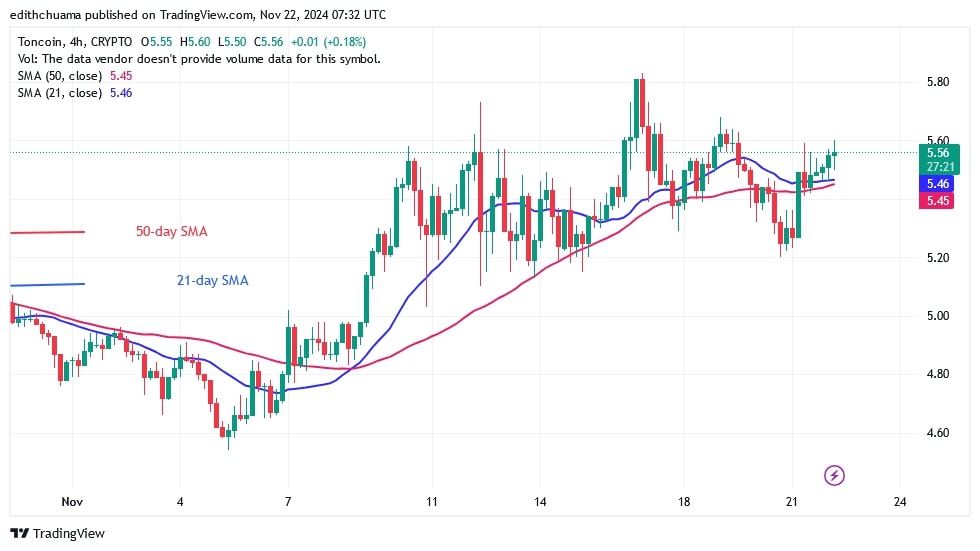
On the 4-hour chart, TON is moving sideways, with support at $5.20 and resistance at $5.80. The price action has been restricted by the doji candlesticks. The altcoin is stabilizing above the moving average lines as it attempts to break through the $5.60 resistance level. If buyers fail to overcome the recent obstacles, the sideways trend will continue.

Disclaimer. This analysis and forecast are the personal opinions of the author. They are not a recommendation to buy or sell cryptocurrency and should not be viewed as an endorsement by CoinIdol.com. Readers should do their research before investing in funds.
News
Price
Price
News
Coin expert

(0 comments)