Toncoin Continues Horizontal Trend And Faces The $8.00 Hurdle
Updated: Jul 05, 2024 at 12:22

Cryptocurrency analysts of Coinidol.com report, Toncoin (TON) is trending sideways after testing the $8.00 resistance level.
Toncoin price long term forecast: bullish
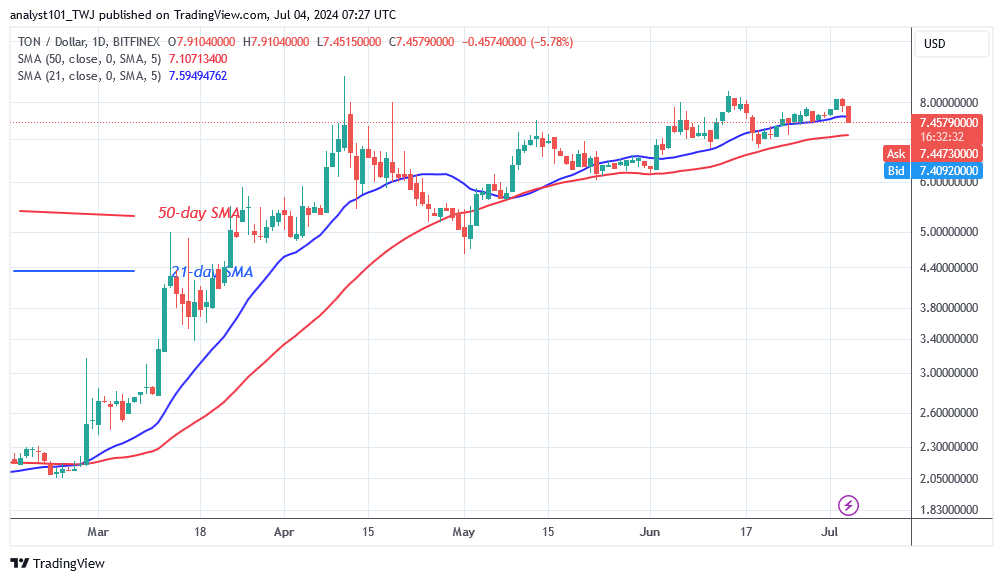
TON is in a bull market and has remained on its uptrend since breaking above the $2.80 resistance level. Since April 12, the uptrend has ended, leaving a horizontal pattern. TON is hovering between the $5.00 and $8.00 price range and buyers have been frantically trading in an attempt to keep the price above the $8.00 overhead bar. If TON breaks through the overhead barrier, it will rise to $10.42. Each time the overhead resistance is retested, TON falls below the moving average lines on the downside. TON has fallen between the moving average lines today. If the price of the altcoin breaks below the moving average lines, it will fall to the current support level of $6.50. If not, it will remain stuck between the moving average lines. At the time of writing, the value is at $7.22.
Toncoin indicator analysis
TON has fallen between the moving average lines. TON will fall further if the price falls below the 50-day SMA support. The price will resume its uptrend if it breaks above the 21-day SMA barrier. Despite the decline, the moving average lines on both charts remain horizontal.

Technical indicators
Resistance levels: $6.00, $8.00, $10.00
Support levels: $5.00, $3.00, $1.00
What is the next move for Toncoin?
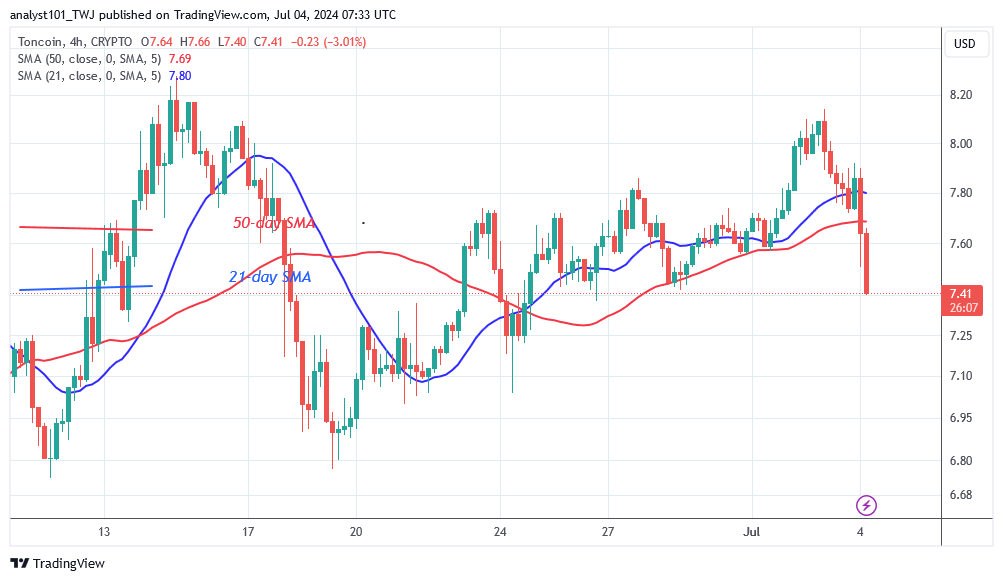
On the 4-hour chart, TON is moving in a range of $6.80 to $8.00. TON is bearish and approaching the current support level of $6.80. The current support level of $6.80 has held since June 7. If TON falls and stays above the current support level, there will be a reversal to the upside.

Disclaimer. This analysis and forecast are the personal opinions of the author and are not a recommendation to buy or sell cryptocurrency and should not be viewed as an endorsement by CoinIdol.com. Readers should do their research before investing in funds.
News
Price
Price
News
Coin expert

(0 comments)