Solana pulls back and approaches its previous low of $120

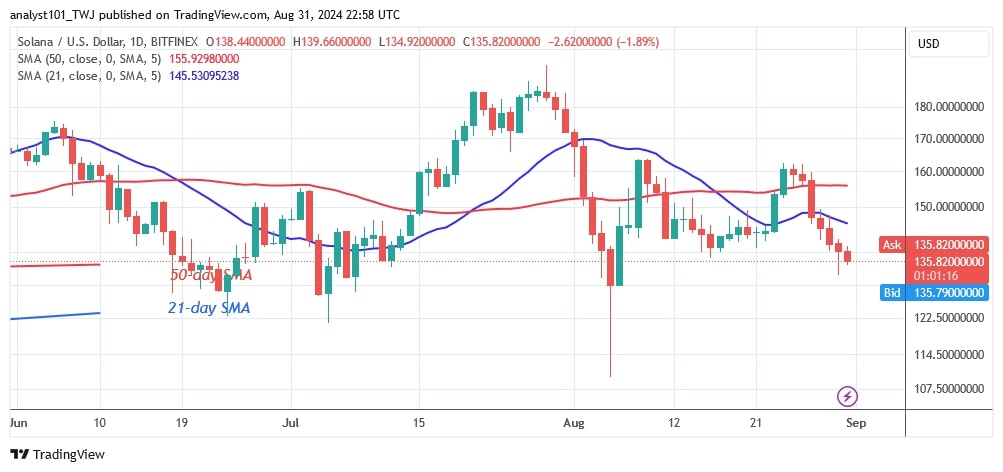
The price of Solana (SOL) has been moving sideways as the altcoin has slipped below its moving average lines. Price analysis by Coinidol.com.
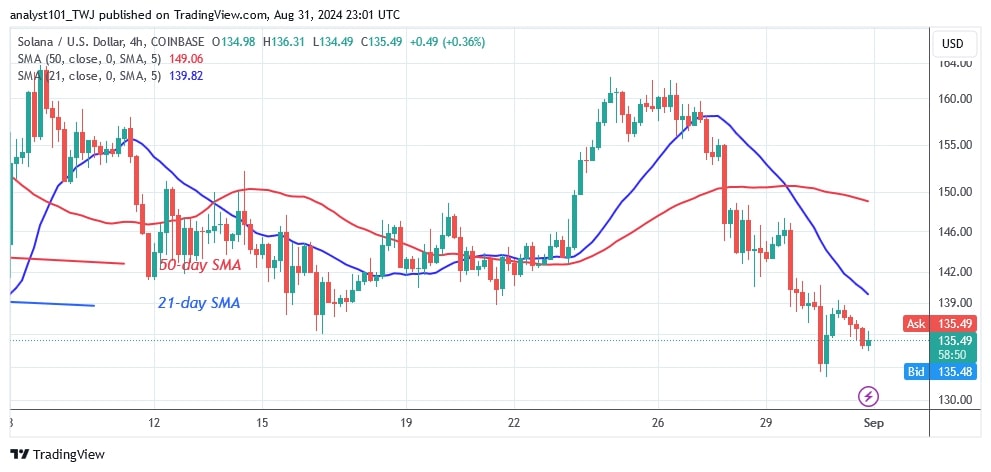
The altcoin has fallen to a low of $130, nearing its lowest price range.
SOL price indicator analysis
During the price rally on August 24, buyers kept the price above the moving average lines but were unable to sustain the upside momentum. The decline will continue to the lower price range with a low of $120. Should the altcoin find support above the $120 low, the market will resume its move between $120 and $190. However, if the bears break the current support at $120, Solana would retest its previous low at $110.
Technical indicators
Key supply zones: $200, $220, $240
Key demand zones: $120, $100, $80
SOL price indicator analysis
After the rejection on August 24, the price bars have fallen below the moving average lines. Both charts contain horizontal moving average lines with a bearish crossover. The altcoin is on the retreat as it approaches the oversold area of the market.

What is the next move for Solana?
The market has been reversing above the $120 support level since April 12, but it is having difficulty breaking through the $190 overhead resistance level. If the current fall remains above the $120 level, Solana will begin its range-bound trend.

Disclaimer. This analysis and forecast are the personal opinions of the author. They are not a recommendation to buy or sell cryptocurrency and should not be viewed as an endorsement by CoinIdol.com. Readers should do their research before investing in funds.
Price
News
Price
Price
News

(0 comments)