Solana Price Wobbles As It Tries To Break Through The $250 Level
Updated: Nov 20, 2024 at 23:26

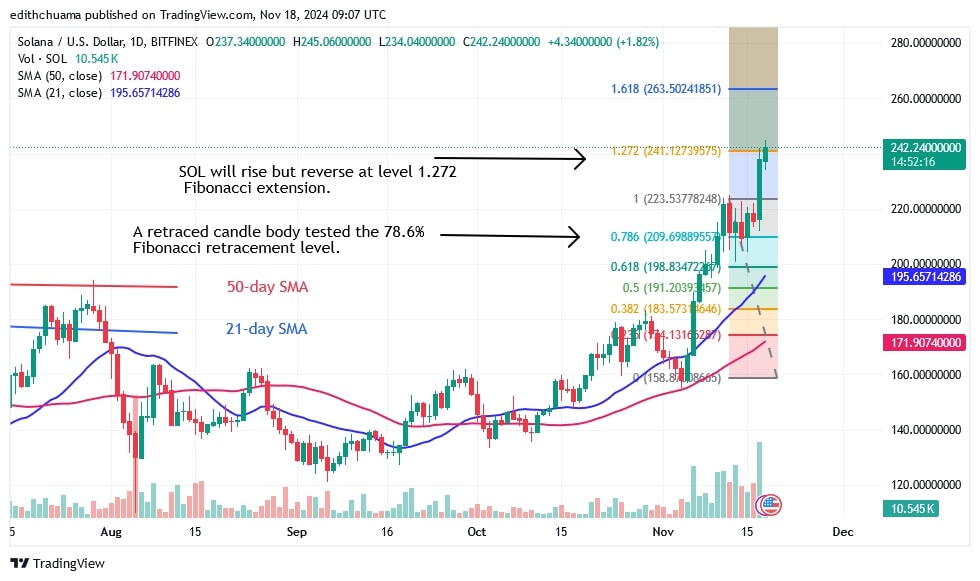
The price of Solana (SOL) has maintained its upward trend, rising to $248 on November 18. The upward movement was halted at the $250 resistance level.
Long-term forecast for the Solana price: bullish
The cryptocurrency is expected to reach its previous high of $260.
However, the November 12 price rally saw a candlestick body approaching the 78.6% Fibonacci retracement line. This retracement shows that Solana will rise but then reverse at the 1.272 Fibonacci extension or the low at $241.12. SOL will fall above the $210 support if it is rejected at its recent high. If the bulls break above the recent barrier, the altcoin will rise to its previous high of $260.
SOL is currently worth $235.
Analysis of Solana price indicators
The moving average lines show a strong uptrend, indicating a current recovery. On November 18, a candlestick wick pointed towards the recent high, indicating significant selling pressure as the altcoin fell back. Doji candlesticks have had an impact on price action.
Technical indicators
Key supply zones: $200, $220, $240
Key demand zones: $120, $100, $80

What is the next move for Solana?
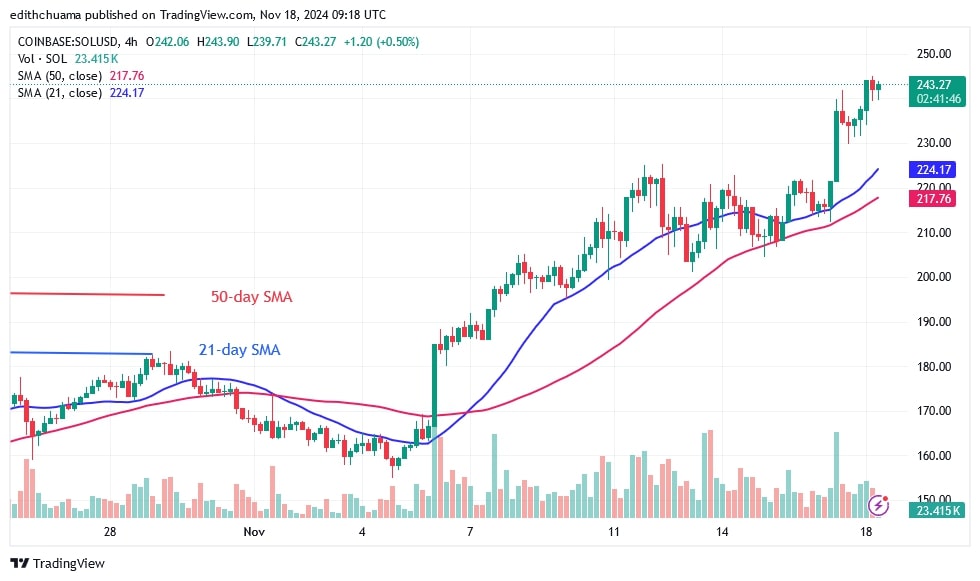
On the 4-hour chart, SOL is in an uptrend and has entered the overbought sector of the market. The altcoin will fall if sellers appear in the overbought area. The uptrend has ended and the price of the cryptocurrency is oscillating below the $250 resistance zone. If the price falls below the moving average lines, selling pressure will increase again.

Disclaimer. This analysis and forecast are the personal opinions of the author, are not a recommendation to buy or sell cryptocurrency, and should not be viewed as an endorsement by CoinIdol.com. Readers should do their research before investing in funds.
Price
Price
News
Price
Price

(0 comments)