Solana Oscillates As It Challenges The Barrier At $155
Updated: Aug 08, 2024 at 11:58

The price of Solana (SOL) is in a sideways trend, but is correcting upwards after a recent decline. Price analysis by Coinidol.com.
Long-term forecast for Solanapice: ranging
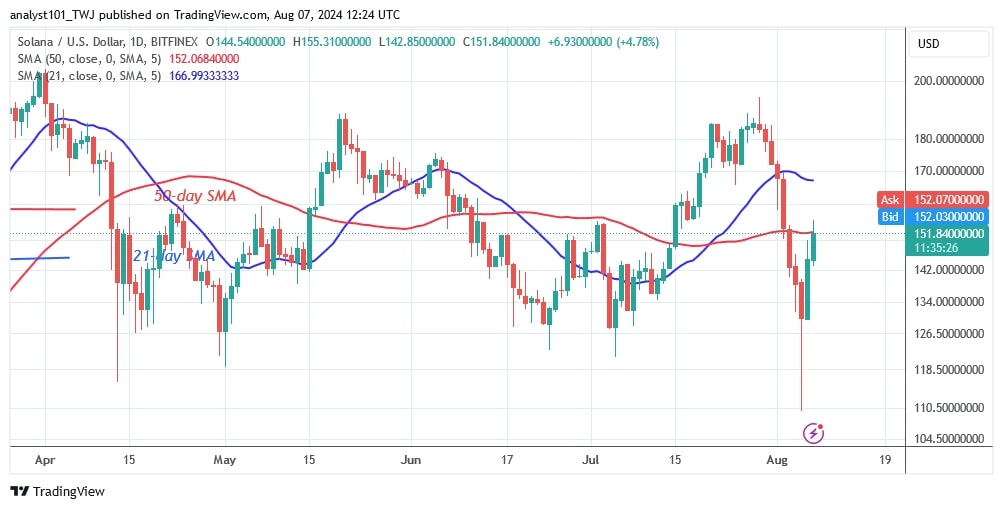
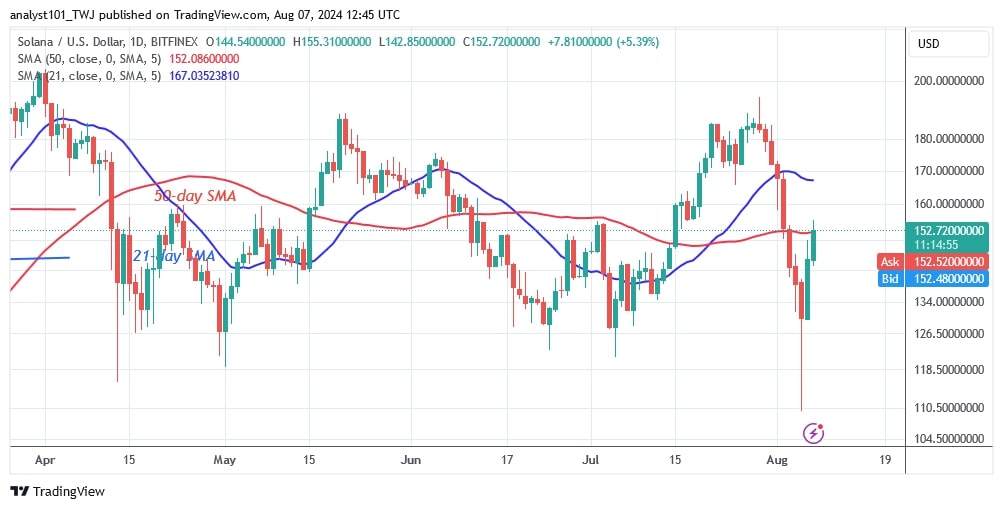
On August 5, Solana fell to a low of $109 but recovered. Since May 20, the altcoin has been moving sideways, above $126 and below the barrier at $190. In the last two months, buyers have failed to keep the price above the $190 resistance level. Today, the upward movement began as it attempted to break through the 50-day SMA.
If the buyers sustain the price above the moving averages, Solana will rise to a high of $190. Meanwhile, the altcoin is trading in the overbought zone of the market.
Technical indicators
Key supply zones: $200, $220, $240
Key demand zones: $120, $100, $80
Analysis of the Solana price indicator
After the recent price decline, the price bars are now below the moving average lines. On the 4-hour chart, the cryptocurrency is trapped between two moving average lines. SOL will oscillate between the moving average lines for a few days.

What is the next move for Solana?
After the recent drop, Solana is trading in a limited range of $110 to $155. On the 4-hour chart, the cryptocurrency is rejected at the recent high as Solana maintains its range-bound movement. Once the altcoin breaks through the $155 resistance level, it will resume its uptrend.

Disclaimer. This analysis and forecast are the personal opinions of the author. They are not a recommendation to buy or sell cryptocurrency and should not be viewed as an endorsement by CoinIdol.com. Readers should do their research before investing in funds.
Price
Price
Price
Price
News

(0 comments)