Shiba Inu Oscillates Above $0.00003 And Maintains Its Sideways Pattern

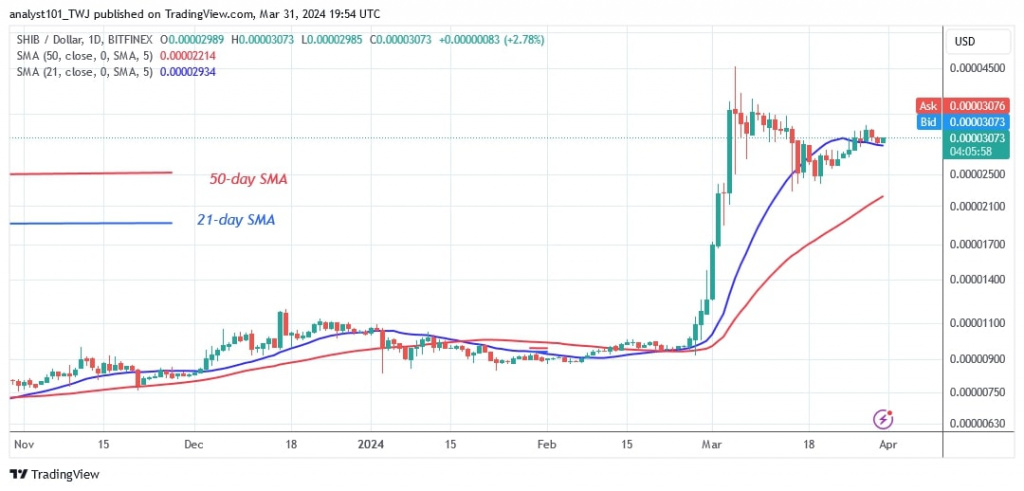
The price of Shiba Inu (SHIB) has continued its uptrend and has risen above the 21-day SMA. Price analysis by Coinidol.com.
Shiba Inu price long-term forecast: bullish
The altcoin is regaining momentum and is on track to reach its previous high of $0.00003500. Moreover, buyers are expected to push the altcoin to the $0.00008251 resistance. At the time of writing, the altcoin is worth $0.00003013.
If the 21-day SMA holds, the altcoin will rally upwards and regain its previous high of $0.00003500. However, if the altcoin falls below the 21-day SMA, it will return to its previous low of $0.00002500.
Analysis of the Shiba Inu indicator
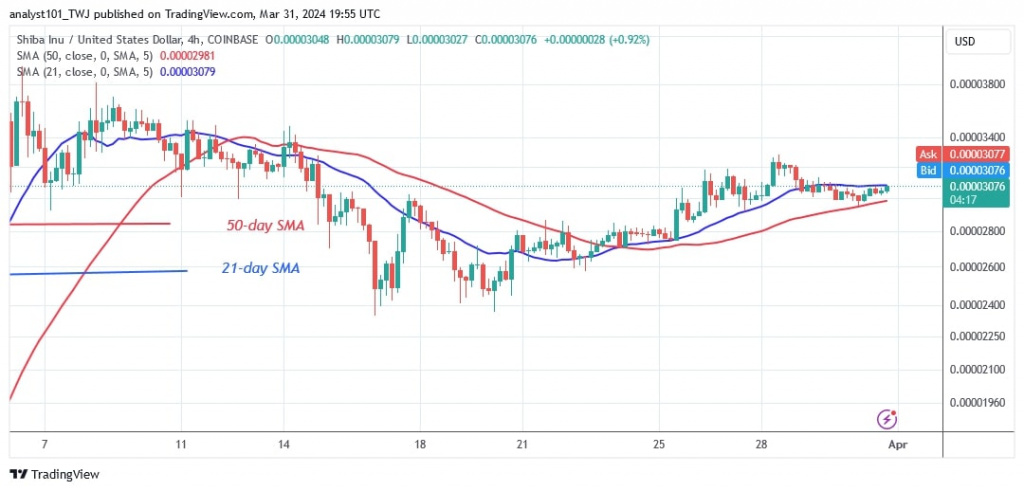
SHIB's price bars have recovered above the 21-day SMA, which was previously bounded by the moving average lines. The price movement was slowed down by the doji candlestick consolidating above the 21-day SMA. On the 4-hour chart, the price bars are located between the horizontal moving average lines. This causes it to oscillate between the moving average lines.
Technical indicators
Key resistance levels: $0.00001200, $0.00001300, $0.00001400
Key support levels: $0.00000600, $0.00000550, $0.00000450

What's next for Shiba Inu?
The SHIB/USD price has continued its sideways pattern, trading between $0.00002700 and $0.00003200. The price action has been delayed by the presence of doji candlesticks. SHIB will widen its range until it rises again.

Disclaimer. This analysis and forecast are the personal opinions of the author and are not a recommendation to buy or sell cryptocurrency and should not be viewed as an endorsement by CoinIdol.com. Readers should do their research before investing in funds.
News
Price
Price
News
Coin expert

(0 comments)