Shiba Inu Breaks Through Current Support And Threatens To Drop To $0.00000962
Updated: May 06, 2023 at 13:16

Shiba Inu (SHIB) price is falling below the moving average lines.
Shiba Inu price long-term forecast: bearish
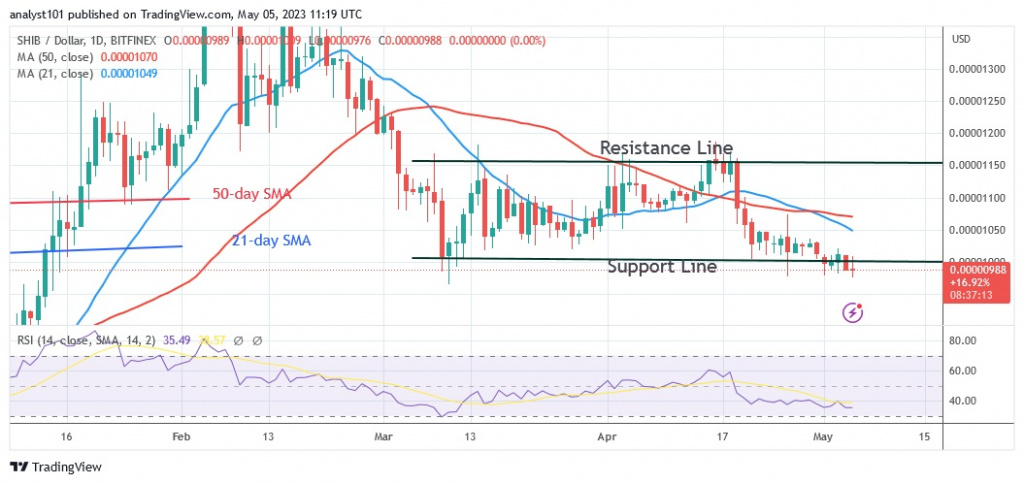
The bears broke the current support on May 4 at the level of $0.00000985. SHIB could fall further if the bearish momentum continues. At the time of writing, the altcoin is trading at $0.00000988. The price indicator has shown that the cryptocurrency's price would continue to fall. If the bearish momentum continues, SHIB will continue to fall and eventually reach a low of $0.00000962. The oversold area of the market will eventually cause the cryptocurrency to recover. The price of the cryptocurrency is currently moving below and above the support of $0.00000985. The uptrend of the altcoin will resume if the current support holds.
Shiba Inu indicator analysis
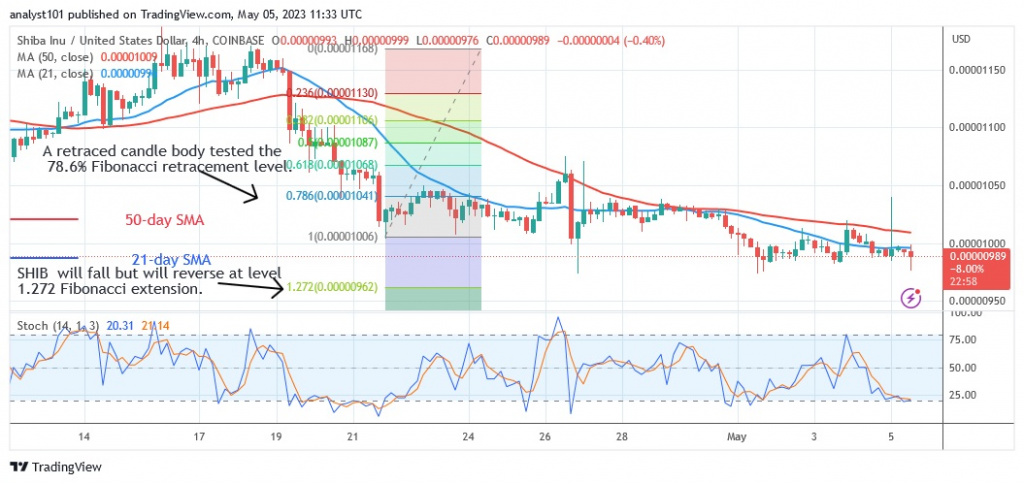
On the Relative Strength Index for period 14, SHIB is at level 35, and the closer it gets to the oversold area of the market, the more the cryptocurrency value falls. As long as the price bars are below the moving average lines, the altcoin will continue to fall. SHIB is below the daily stochastic level of 20, and as soon as buyers show up, the selling pressure in the oversold area is likely to ease.

Technical indicators
Key resistance levels: $0.00001200, $0.00001300, $0.00001400
Important support levels: $0.00001100, $0.00001000, $0.00000900
What is the next move for Shiba Inu?
SHIB is expected to fall further as it violates current support. However, the Doji candlesticks are preventing further price movement. The small body candlesticks have slowed down the price movement. During the downtrend that started on April 21, SHIB formed an upward correction and the candlestick tested the 78.6% Fibonacci retracement level. SHIB will decline but reverse price at the 1.272 Fibonacci extension level or $0.00000962, in line with the correction.

Disclaimer. This analysis and forecast are the personal opinions of the author and are not a recommendation to buy or sell cryptocurrency and should not be viewed as an endorsement by CoinIdol. Readers should do their own research before investing in funds.
News
Price
Price
News
Coin expert

(0 comments)