Shiba Inu Holds Above $0.00001330 And Continues Its Upward Trend

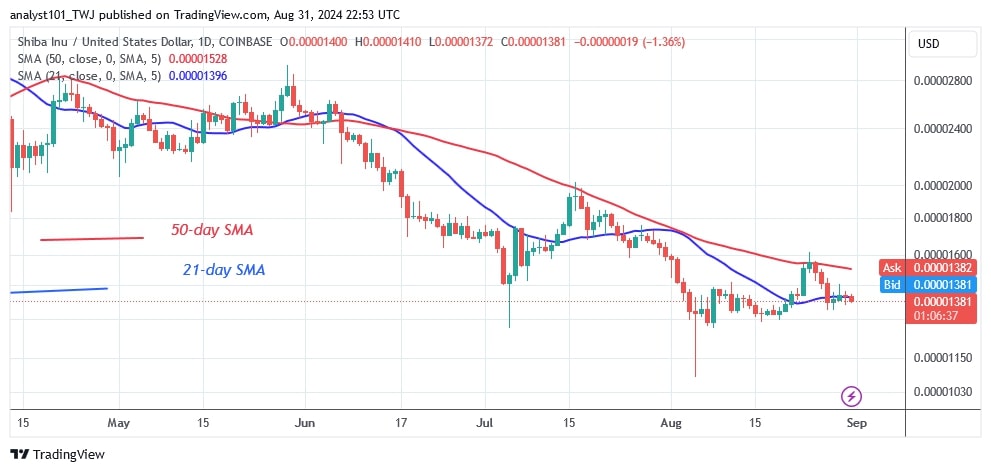
The price of Shiba Inu (SHIB) fell below the 21-day SMA support, resuming the selling pressure.
The bulls had previously tried to keep the price above the moving average lines but were unsuccessful. This resulted in the cryptocurrency moving between the moving average lines.
SHIB price long-term prediction: bearish
Today, SHIB has fallen below the moving average lines, suggesting that the price could retrace to a lower price range.
Nonetheless, the altcoin has been trading above the $0.00001290 support but below the moving average lines since its recovery. If the support holds, the trend will continue within the trading range. If the bears break the lower price range, SHIB will crash and reach its previous low of $0.00001079. Currently, SHIB is trading at $0.00001373.
SHIB indicator analysis
The price bar has fallen below the 21-day SMA after getting caught between the moving average lines. Altcoins tend to fall when they trade below the moving average lines.
However, due to the existence of Doji candlesticks, price movement is extremely slow.
Technical indicators
Key Resistance levels: $0.00001200, $0.00001300, $0.00001400
Key Support levels: $0.00000600, $0.00000550, $0.00000450

What is the next move for Shiba Inu?
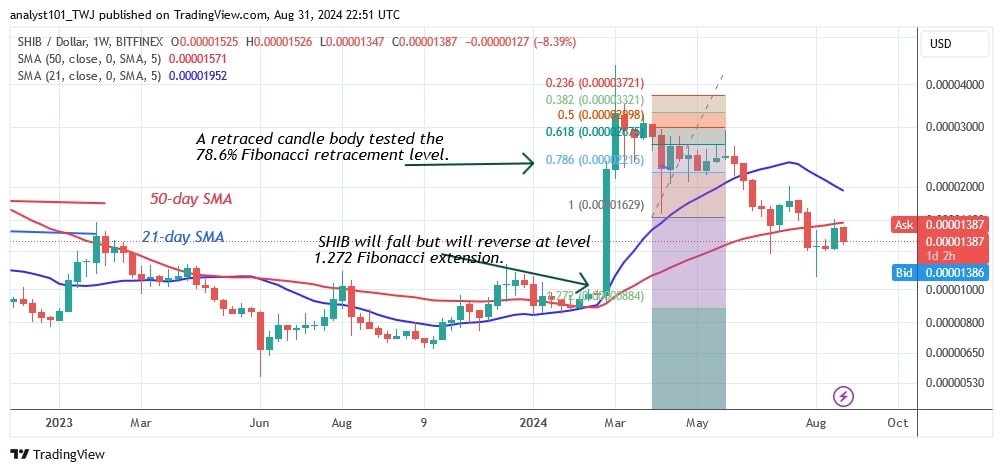
SHIB/USD has fallen to a range of $0.00001290 and below the moving average lines. If the price of the cryptocurrency falls below the support level of $0.00001290, the selling pressure will increase again. With this in mind, buyers will try to revive the uptrend.

Disclaimer. This analysis and forecast are the personal opinions of the author. They are not a recommendation to buy or sell cryptocurrency and should not be viewed as an endorsement by CoinIdol.com. Readers should do their research before investing in funds.
News
Price
Price
News
Coin expert

(0 comments)