Ripple Trades Marginally Below the $1.10 Resistance Level
Updated: Oct 08, 2021 at 09:32

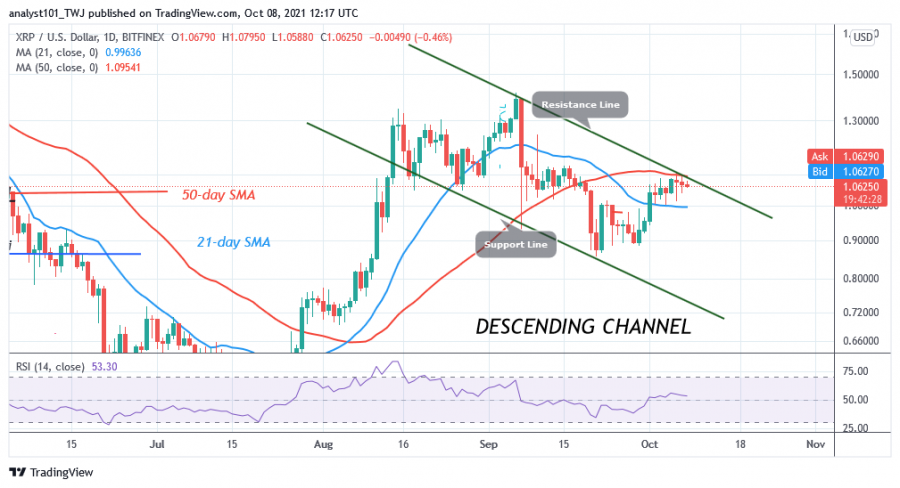
Since October 1, Ripple (XRP) has been trading just slightly below the $1.10 resistance level. There has been no significant price action as doji candlesticks and spinning tops have been seen.
The candlesticks describe buyers and sellers behaving indifferently to the direction of the market. This has caused the XRP price to stagnate. The XRP price is unstable as it fluctuates between the price levels of $1.04 and $1.08.
These price levels are between the 21-day line SMA and the 50-day line SMA. If buyers keep the XRP price above the 50-day line SMA, the altcoin will resume its upward movement. XRP/USD will rise to regain the previous high of $1.41. However, if the bears break below the 21-day line SMA, XRP will fall back to the previous low of $0.85. At the time of writing, XRP is trading at $1.06.
Ripple indicator analysis
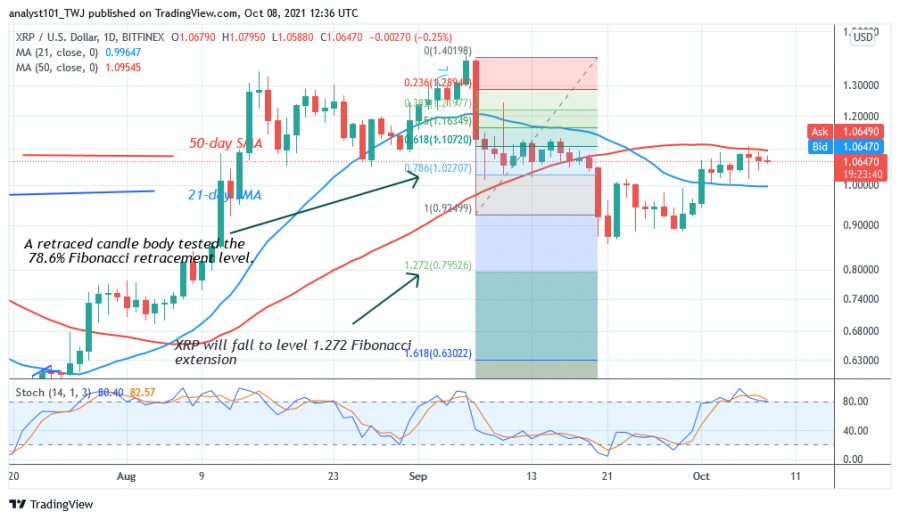
The price of the cryptocurrency has risen to level 53 on the Relative Strength Index for period 14. This means that XRP is in the upward zone and above the middle line 50. Ripple will trend upwards if the price breaks above the 50-day line SMA. Currently, the bears are defending the 50-day line SMA. XRP is above the 80% area of the daily stochastic. This indicates that the market has reached the overbought area. As a result, Ripple is likely to fall.

Technical indicators:
Major Resistance Levels - $1.95 and $2.0
Major Support Levels - $0.80 and $0.60
What is the next move for Ripple?
XRP/USD could continue its downtrend if it is rejected at the $1.10 resistance level. Meanwhile, the September 7 downtrend has shown a candle body testing the 78.6% Fibonacci retracement level. The retracement suggests that XRP will likely continue to fall, but will reverse at the Fibonacci extension of 1.272 or $0.79.

Disclaimer. This analysis and forecast are the personal opinions of the author and are not a recommendation to buy or sell cryptocurrency and should not be viewed as an endorsement by CoinIdol. Readers should do their own research before investing.
Coin expert
Price
Price
News

(0 comments)