Ripple Makes Positive Moves to the Upside but Struggles below $1.00

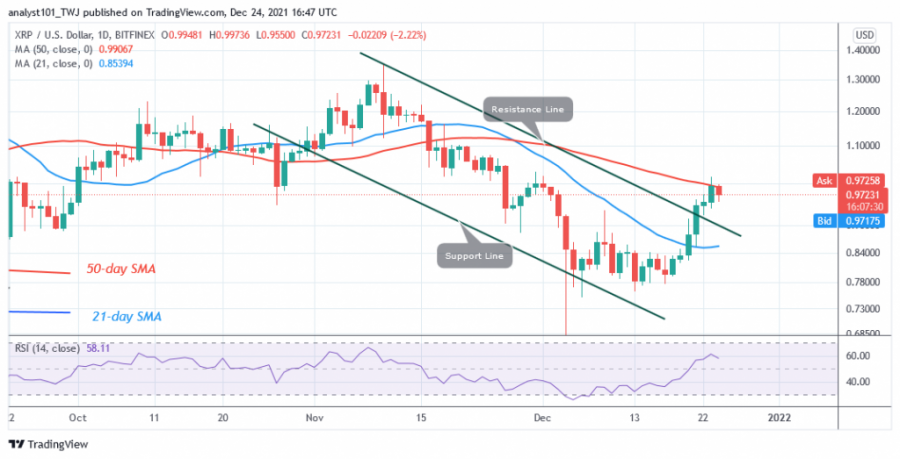
The price of Ripple (XRP) has made positive moves over the past week. Buyers have risen above the 21-day moving average line, and the price is retesting the 50-day moving average line.
A break above the 50-day moving average line will accelerate the resumption of the uptrend. Today, Ripple is falling after reaching resistance at $1.01.
Incidentally, it is also rejected by the 50-day moving average line. The uptrend will continue if the price rises above the 50-day moving average or breaks above the resistances at $1.01 and $1.10. Then XRP will reach the previous high of $1.30. On the other hand, if XRP is pushed back at the 50-day moving average, Ripple will fall and enter a trading range between the two moving averages. In the meantime, the bulls are struggling to break above the 50-day moving average.
Ripple indicator analysis
XRP is at level 58 of the Relative Strength Index for the period 14. The cryptocurrency has moved up into the bullish trend zone and can continue to rise. The price of the cryptocurrency is above the 21-day moving average, but below the 50-day moving average. There is a tendency for the cryptocurrency to move between the moving averages. Ripple is below the 80% area of the stochastic on the daily chart. The market is in a bearish momentum.

Technical indicators:
Major Resistance Levels - $1.95 and $2.0
Major Support Levels - $0.80 and $0.60
What is the next move for Ripple?
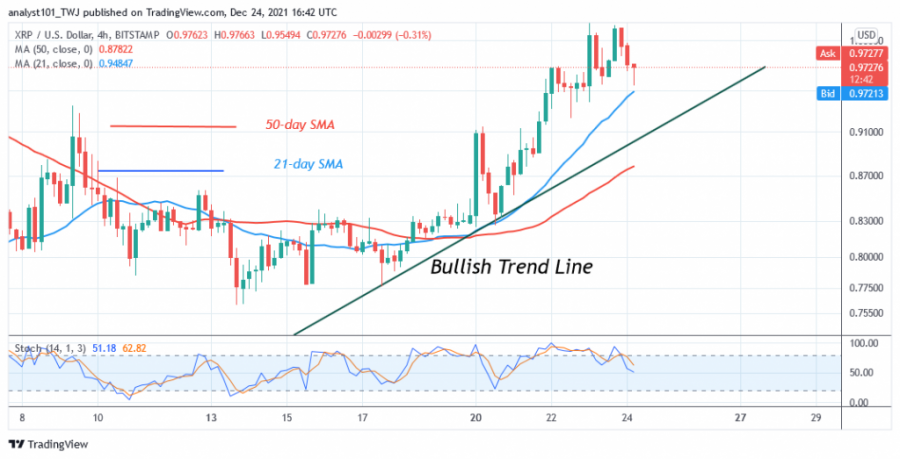
Ripple has resumed its uptrend. The XRP price is posting a series of higher highs and higher lows. A bullish trend line indicates the support levels of the prices. The uptrend continues when the price tests the moving average or trend line. Today, XRP is again testing the 21-day moving average line for a possible upside move. The cryptocurrency is trading at $0.97 as of press time.

Disclaimer. This analysis and forecast are the personal opinions of the author and are not a recommendation to buy or sell cryptocurrency and should not be viewed as an endorsement by CoinIdol. Readers should do their own research before investing
Price
News
Coin expert
News
News

(0 comments)