Ripple Stuck Below $0.248 Resistance, Unable to Push to Upside

Following the recent rebound above $0.22 support and the subsequent rise above $0.24, Ripple has resumed a sideways move below the 0.248 resistance.
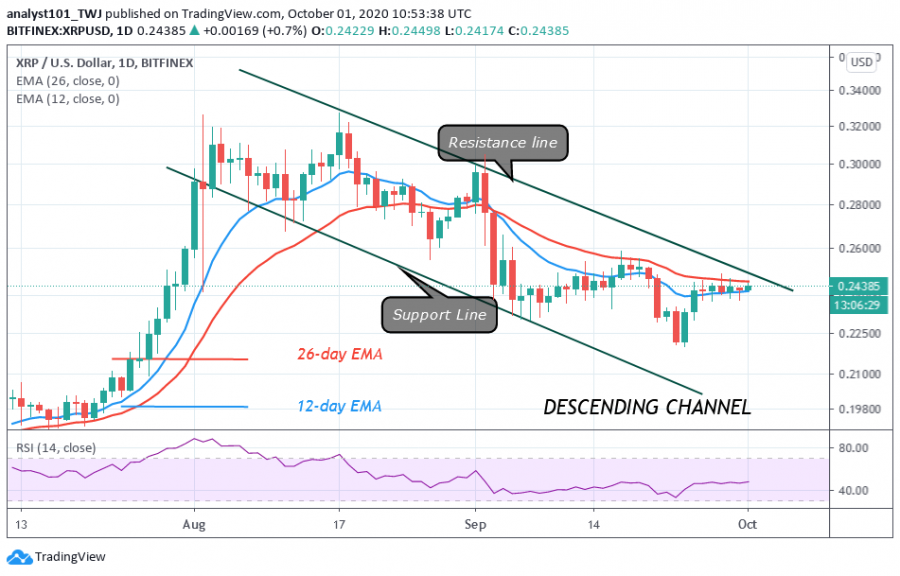
The range-bound movement becomes necessary because buyers have failed to push the price above the $0.248 resistance. As a result, XRP has been on a sideways move for the past week. Each time, XRP retests the resistance zone, the price will fall to $0.238 support and resume upward immediately.
Today, XRP is trading at $0.244 but fluctuates between $0.238 and $0.248 price levels. The upside momentum will resume if buyers break the $0.248 resistance. Once resistance is broken, the market will reach a high of $0.26. At this support, the market will have an accelerated price movement to $0.30 high. However, if the bears eventually break below $0.238 support the downtrend will resume.
Ripple indicator analysis
XRP is at level 49 of the Relative Strength Index period 14. It indicates that there is a balance between supply and demand. XRP price is still in the bearish trend zone as the upward move will be an uphill task.

Key Resistance Zones: $0.35, $0.40, $0.45
Key Support Zones: $0.25, $0.20, $0.15
What is the next move for Ripple?
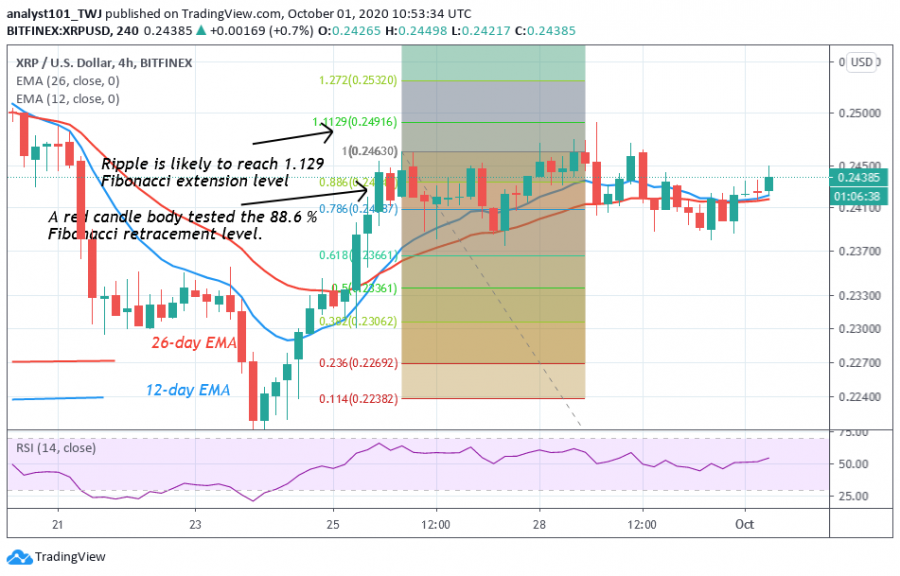
Ripple uptrend is hindered as the coin continues its sideways move below the resistance. On September 26, a red retraced candle body tested the 88.6 % Fibonacci retracement level. It indicates that the market will rise and reach the 1.129 Fibonacci extension level. That is XRP will reach a high of $0.249.

Disclaimer. This analysis and forecast are the personal opinions of the author that are not a recommendation to buy or sell cryptocurrency and should not be viewed as an endorsement by CoinIdol. Readers should do their own research before investing funds.
Coin expert
Price
Coin expert
Price
Coin expert

(0 comments)