Ripple Fails to Sustain Above $0.80, Risks Further Decline to $0.69

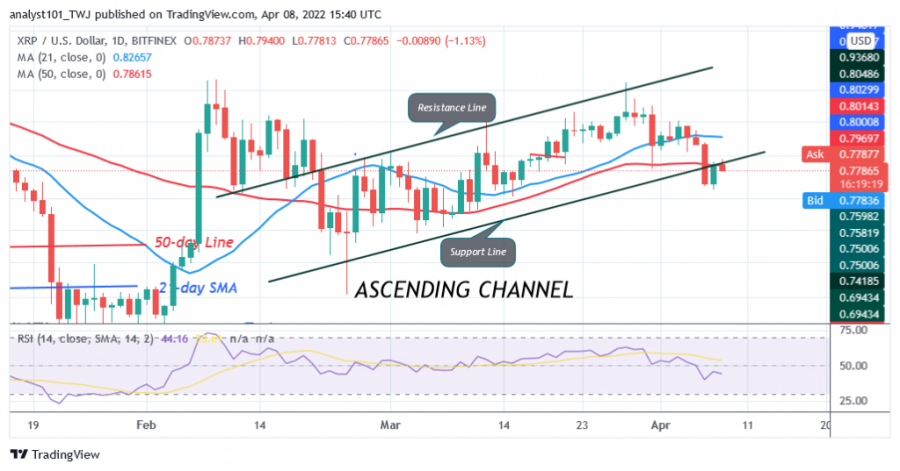
The price of Ripple (XRP) has fallen into the bearish trend zone. On April 6, the bears broke below the moving averages as the altcoin fell above $0.75. Bulls bought the dips, but the upward correction got stuck below the 50-day line SMA.
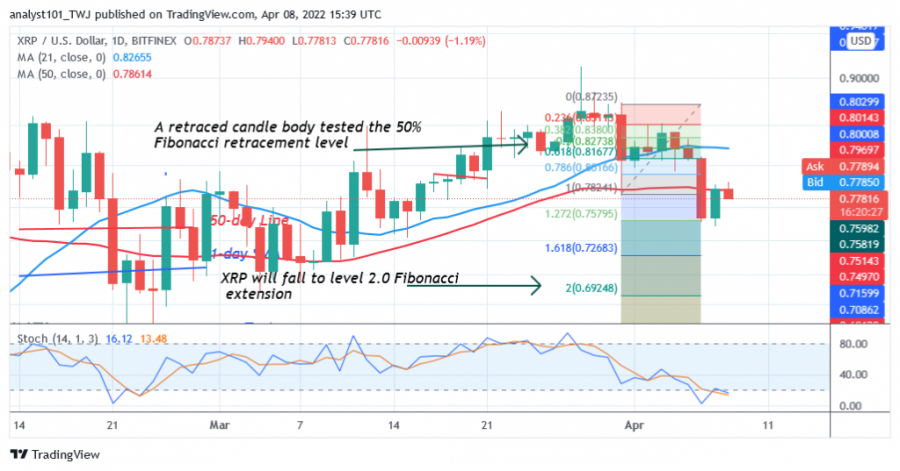
In the downtrend zone, the bears have an advantage over the bulls as the altcoin is vulnerable to a decline. Today, the bulls are trying to break above the 50-day line SMA. Ripple will return above the moving averages if buyers break out above the 50-day line SMA. However, if the cryptocurrency turns away from the 50-day line SMA, the bears will break the support at $0.75. There is a tendency for XRP to fall back to the low at $0.69. XRP/USD is falling and trading at $0.78 at the time of writing.
Ripple indicator analysis
The price of XRP is below the 21-day line and the 50-day moving average line, which indicates further downward movement of the cryptocurrency. Ripple has fallen to the 44 level of the Relative Strength Index for the 14 period. XRP has fallen into the downtrend zone and may move further down. XRP/USD is below the 20% range of the daily stochastic. This indicates that XRP is in the bullish trend zone.

Technical indicators:
Major Resistance Levels - $1.95 and $2.0
Major Support Levels - $0.80 and $0.60
What is the next move for Ripple?
XRP/USD resumed its downward movement after the price fell below the moving averages. Meanwhile, on March 31, the downtrend has seen a retreating candlestick testing the 50% Fibonacci retracement level. The retracement suggests that XRP will fall to the 2.0 level of the Fibonacci extension or $0.69. Based on the price action, XRP has fallen and reached the low of $0.77.

Disclaimer. This analysis and forecast are the personal opinions of the author and are not a recommendation to buy or sell cryptocurrency and should not be viewed as an endorsement by CoinIdol. Readers should do their own research before investing
Price
Price
Price
Price
Price

(0 comments)