Binance Coin Is Stable And Consolidated Above $600
Updated: Dec 02, 2024 at 11:34

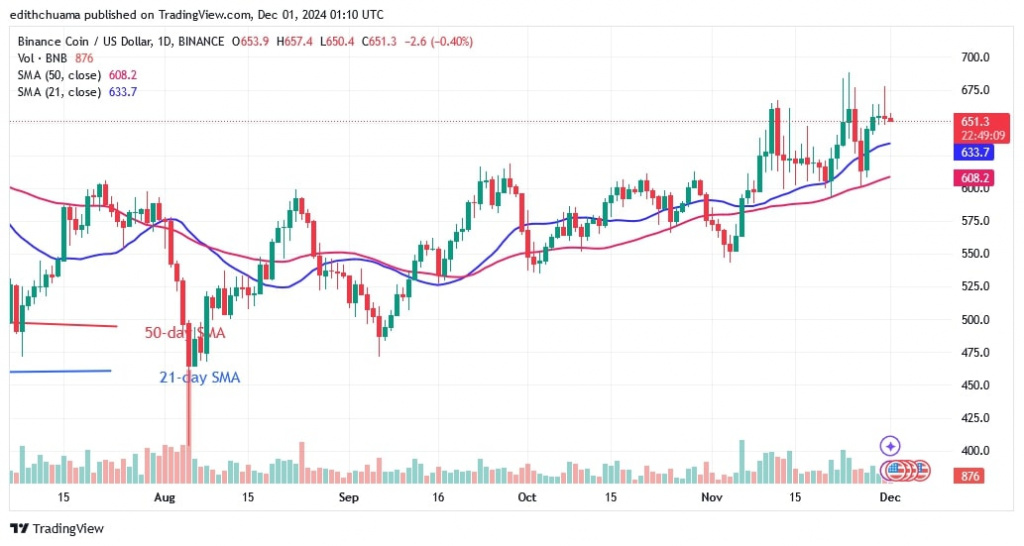
Binance Chain Native Token (BNB) has risen to a high of $688 and has resumed its sideways movement. The price of the cryptocurrency is approaching its record high of $724.
BNB long term forecast: ranging
However, the altcoin will decline every time it reaches the $700 resistance level. On the other hand, BNB has entered the overbought sector of the market, so a further rise in prices is unlikely.
On November 30, BNB reached a high of $677.50 before quickly falling above the $600 support. At the time of writing, the BNB price has remained steady and has settled at $655.
BNB price indicator analysis
Since November 23, as reported by Coinidol.com, the cryptocurrency has shown extended candle wicks at the $680 resistance level. This shows that there is significant selling pressure at higher prices.
In addition, doji candlesticks have appeared again, so the price action remains stationary. The moving average lines are sloping horizontally and the 21-day SMA is above the 50-day SMA, indicating a move higher.
Technical indicators:
Resistance Levels – $600, $650, $700
Support Levels – $400, $350, $300

What is the next direction for BNB/USD?
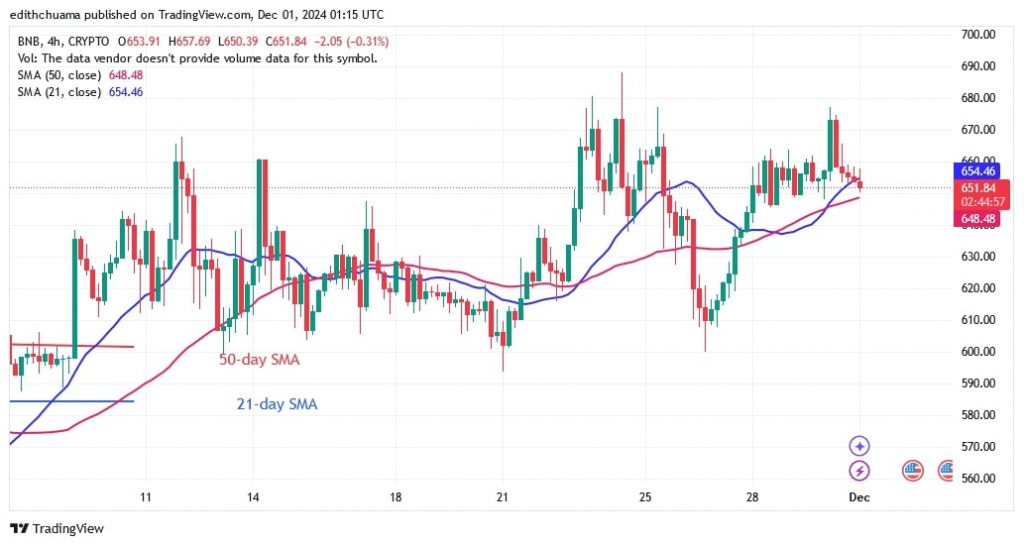
On the 4-hour chart, BNB continues to trade sideways above the moving average lines but below the $680 resistance level. The altcoin has pulled back above the 21-day SMA and is consolidating above it. BNB's uptrend will continue as long as the price remains above the moving average lines. The negative trend will resume once the moving average lines are breached.

Disclaimer. This analysis and forecast are the personal opinions of the author. They are not a recommendation to buy or sell cryptocurrency and should not be viewed as an endorsement by CoinIdol.com. Readers should do their research before investing in funds.
Price
News
Price
Price
Price

(0 comments)