XRP Is In A Strong Uptrend And Is Trying To Break Above $2.00

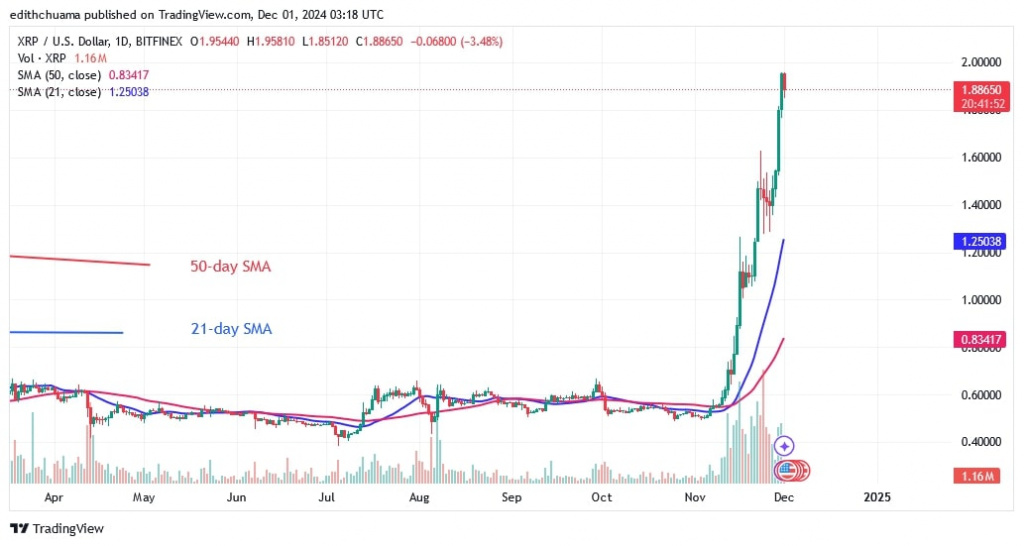
The price of Ripple (XRP) has maintained its uptrend and reached a high of $1.95. The cryptocurrency is recovering from its downturn after breaking through the $1.00 and $1.40 resistance levels.
XRP long term analysis: bullish
It is predicted that XRP will recover and reach its historical price of $3.30. During the November 23rd upswing, a retracement candle tested the 50% Fibonacci retracement level. The retracement suggests that XRP will continue to rise to the Fibonacci extension of $2.0 or the low of $2.24.
However, if XRP is rejected at the $2.00 resistance zone, it will retrace and fall above the 21-day SMA or the $1.25 low. XRP is now worth $1.89.
XRP indicator analysis
The moving average lines have continued to tilt north as the price of the altcoin rises. The cryptocurrency is moving into the overbought area of the market. Doji candlesticks have determined the price movement of the cryptocurrency and slowed the momentum.
Technical indicators:
Resistance Levels – $1.40 and $1.60
Support Levels – $1.00 and $0.80

What is the next direction for XRP?
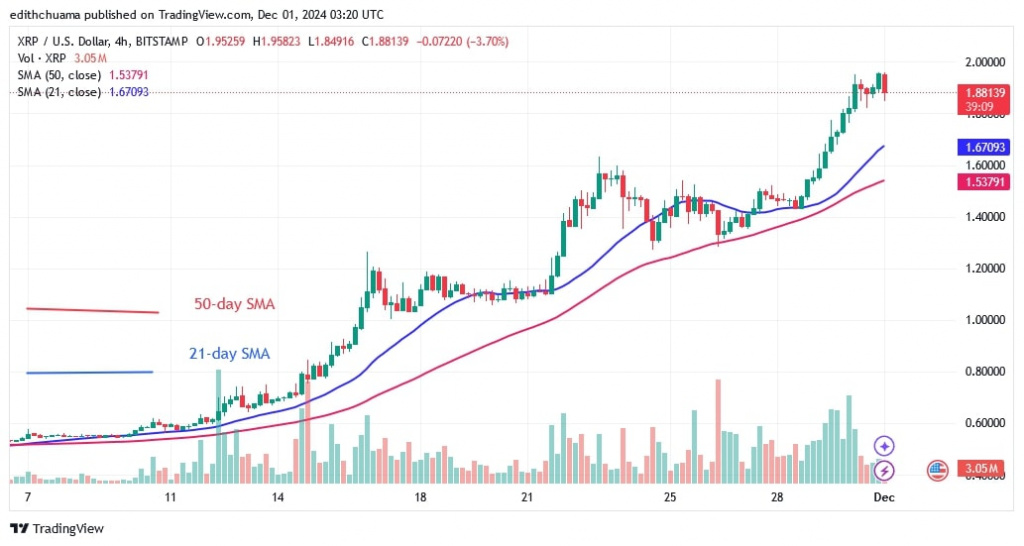
On the 4-hour chart, XRP is in an uptrend, with higher highs and higher lows. The altcoin rose to a high of $1.95 before beginning a sideways movement below the recent high. Meanwhile, the altcoin is trading above the $1.80 support but below the $2.00 mark. XRP will continue to move higher once the boundaries of the trading range are broken.

Disclaimer. This analysis and forecast are the personal opinions of the author, are not a recommendation to buy or sell cryptocurrency, and should not be viewed as an endorsement by CoinIdol.com. Readers should do their research before investing in funds.
Price
News
Price
News

(0 comments)