Ripple Consolidates Above $0.31 for a Possible Price Rebound

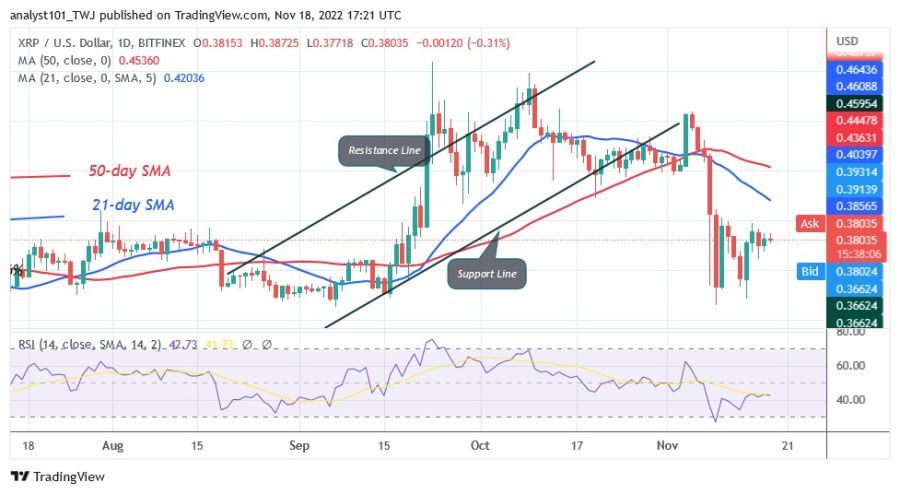
Ripple (XRP) is trading above the $0.31 support and is in a downtrend. The cryptocurrency's downturn has eased as a sideways trend has set in.
The support of $0.31, which was historically the price level for July, was not broken by sellers. Since July, the cryptocurrency has regained ground above the current support.
For example, on September 22, XRP bounced back and overcame the $0.41 resistance. Nevertheless, the bullish trend continued until the high of $0.55. As the market entered the overbought zone, the uptrend could not be maintained. At the time of writing, the price of XRP is at $0.38. If the price of XRP returns and exceeds the breakout level of $0.41, the uptrend will resume. Ripple will return to its highs of $0.45 and $0.50.
Ripple indicator analysis
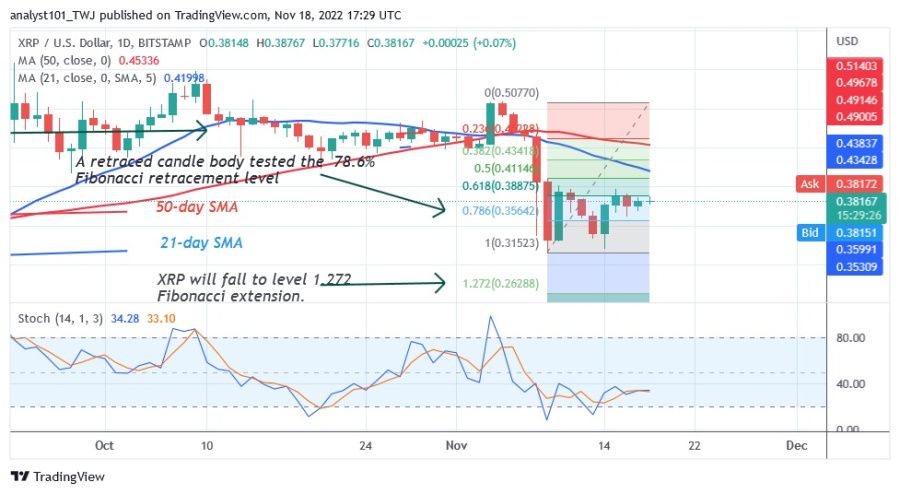
On the Relative Strength Index, Ripple is at 43 for the 14 period, indicating that XRP is in a downtrend and could fall further. Since the price is below the moving average lines, a probable decline is indicated. XRP is moving up above the 30 level of the daily stochastic.

Technical indicators:
Major Resistance Levels - $0.80 and $1.00
Major Support Levels - $0.40 and $0.20
What is the next move for Ripple?
Ripple has reached bearish exhaustion as it consolidates above the $0.31 support. A minor price move below the current support level, as shown by the price indicator, will cause a trend reversal. The downtrend from November 9 was corrected upwards by XRP, and a candlestick tested the 78.6% Fibonacci retracement line. After the correction, XRP will fall below the $0.26 level of the 1.272 Fibonacci extension.

Disclaimer. This analysis and forecast are the personal opinions of the author and are not a recommendation to buy or sell cryptocurrency and should not be viewed as an endorsement by CoinIdol. Readers should do their own research before investing
Price
Coin expert
News
Price
Price

(0 comments)