Ripple Coin Struggles Below $0.62 And Risks Further Decline

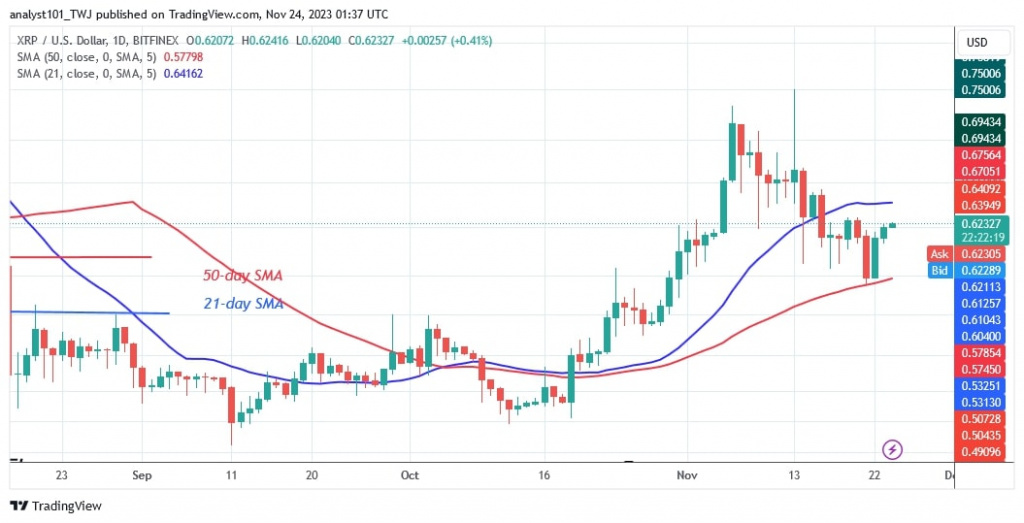
The price of Ripple (XRP) has stabilized above the 50-day simple moving average (SMA) or the low of $0.57. Detailed cryptocurrency price analysis by Coinidol.com.
Long-term forecast of the Ripple coin price: bearish
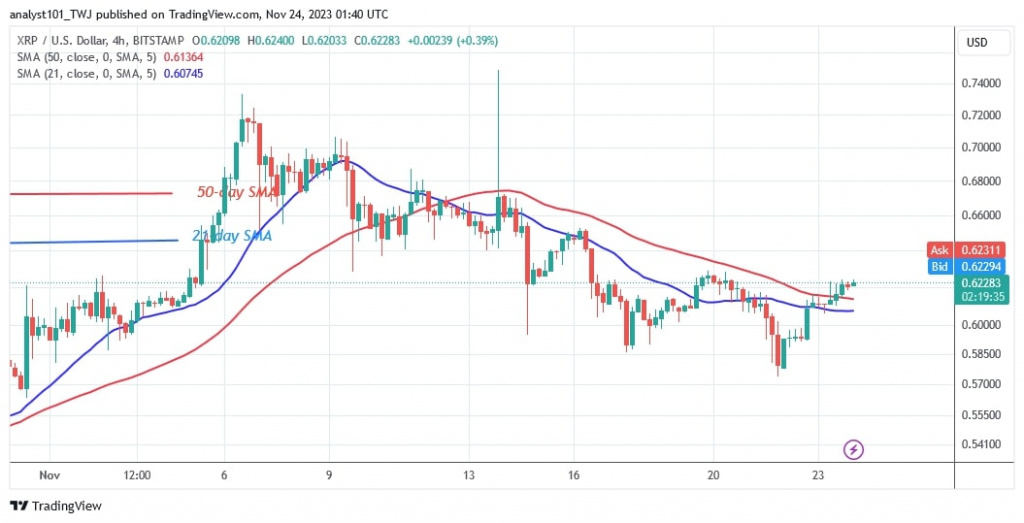
The cryptocurrency is correcting upwards to retest or break the 21-day simple moving average. Approaching the high of $0.62, the upward correction is encountering resistance. Since the beginning of its decline, the price of the cryptocurrency has made a series of lower highs and lower lows. Currently, Ripple is retesting a lower high. A break above the current lower high will signal the end of the downtrend. That is, XRP will return to its high of $0.73.
On the other hand, XRP will fall to its previous low of $0.57, where it will meet the resistance of the recent high. In other words, the price of the cryptocurrency will fluctuate if the moving average lines remain unbroken.
XRP indicator analysis
The upward movement has stalled at the high of $0.62, which is below the 21-day SMA. The price of the cryptocurrency is trapped between the moving average lines. Prices could start to fluctuate between the moving average lines. The moving average lines on the 4-hour chart are pointing downwards due to the recent decline.
Technical Indicators:
Key resistance levels – $0.80 and $1.00
Key support levels – $0.40 and $0.20

What's the next move for XRP?
Despite the recent rise, the cryptocurrency is still in a downtrend. If the cryptocurrency is rejected at $0.62, selling pressure will resume. If the current resistance level is broken, the altcoin will resume its climb.
Coinidol.com reported before that Ripple has been rejected twice at the resistance levels of $0.74 and $0.75. On November 13, the extended candlestick tail is a sign of significant selling pressure at high price levels.

Disclaimer. This analysis and forecast are the personal opinions of the author and are not a recommendation to buy or sell cryptocurrency and should not be viewed as an endorsement by CoinIdol.com. Readers should do their research before investing in funds.
Coin expert
News
Coin expert
Price
Coin expert

(0 comments)