Ripple May Resume a Downtrend if the Coin Loses $0.78 Support

Ripple (XRP) is in a downward correction as the price is below the moving averages. XRP plunges to a low of $0.78 after rejecting resistance at $0.90.
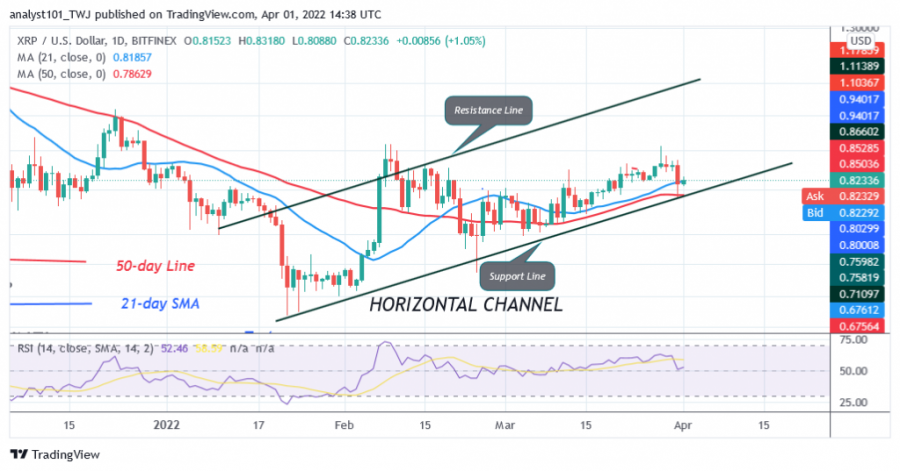
Buyers have failed to overcome the resistance at $0.90 since February 8. The cryptocurrency has broken above the 50-day line SMA, but has fallen below the 21-day line SMA.
In other words, the XRP price is between the moving averages. If the bulls break the 21-day moving averages to the upside, it would be a sign of resumption of the uptrend. The market will regain the previous high of $0.90. If the price breaks below the 50-day moving averages line, the downtrend will resume. XRP will fall to the low of $0.69. Today, buyers are trying to keep the price above the moving averages. At the time of writing, XRP is trading at $0.82..
Ripple indicator analysis
Ripple has fallen to level 52 of the Relative Strength Index for the period 14. The cryptocurrency is in the uptrend zone despite the initial retracement. The moving averages of the 21-day line and the 50-day line are up, indicating an uptrend. The cryptocurrency's price bars are between the moving averages, which forces the altcoin to move back in a range. XRP/USD is above the 40% range of the daily stochastic. This indicates that XRP is in a bullish momentum.

Technical indicators:
Major Resistance Levels - $1.95 and $2.0
Major Support Levels - $0.80 and $0.60
What is the next move for Ripple?
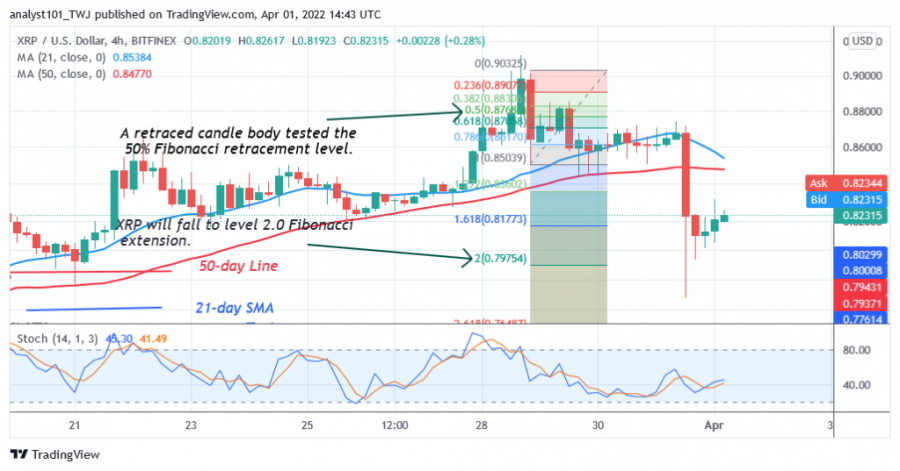
XRP/USD is in a downtrend as the price has fallen below the moving averages. Selling pressure has reached bearish exhaustion. Meanwhile, the March 28 uptrend has a candle body testing the 50% Fibonacci retracement level. The retracement suggests that XRP will fall to the 2.0 Fibonacci extension level or $0.79. The price action shows that XRP has retested the 2.0 Fibonacci extension and is trending up again.

Disclaimer. This analysis and forecast are the personal opinions of the author and are not a recommendation to buy or sell cryptocurrency and should not be viewed as an endorsement by CoinIdol. Readers should do their own research before investing.
Price
Price
Coin expert
News
Coin expert

(0 comments)