Ripple Crashes On Hitting The Low Of $0.41 Again
Updated: Jun 16, 2023 at 16:25

Ripple (XRP) is falling below the moving average lines from June 14.
Long-term forecast for Ripple price: bearish
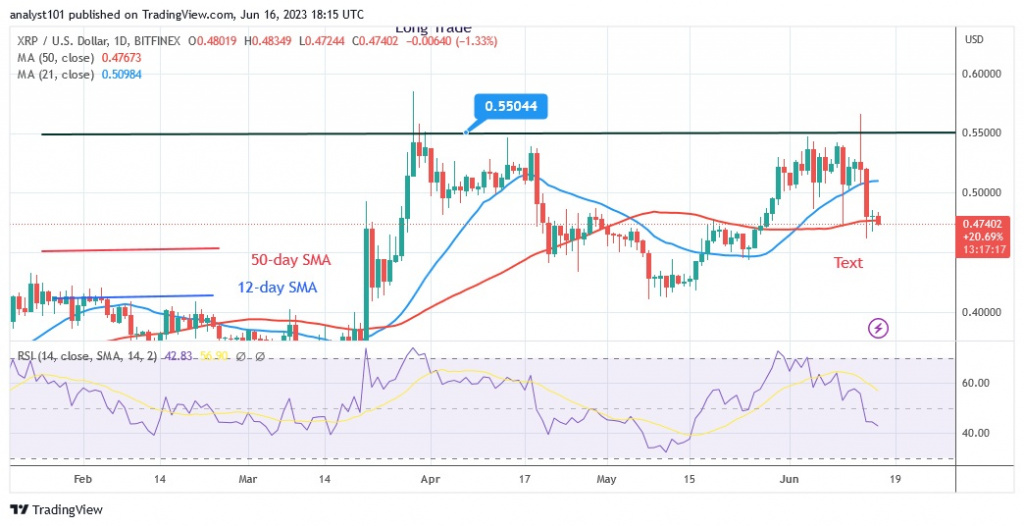
The price of XRP rallied on June 13 when it surpassed the moving average. The rally was stopped at the high of $0.56, so it was temporary. As soon as the altcoin's price fell below the moving average lines, it dropped quickly. The price of Ripple would have been in a range if it fell below the 12-day line SMA. Currently, the price of the cryptocurrency has moved below the moving average lines. Therefore, XRP will continue to fall until it reaches its previous low of $0.41. Since March 22, the cryptocurrency has continued to trade above the $0.41 support.
Ripple indicator analysis
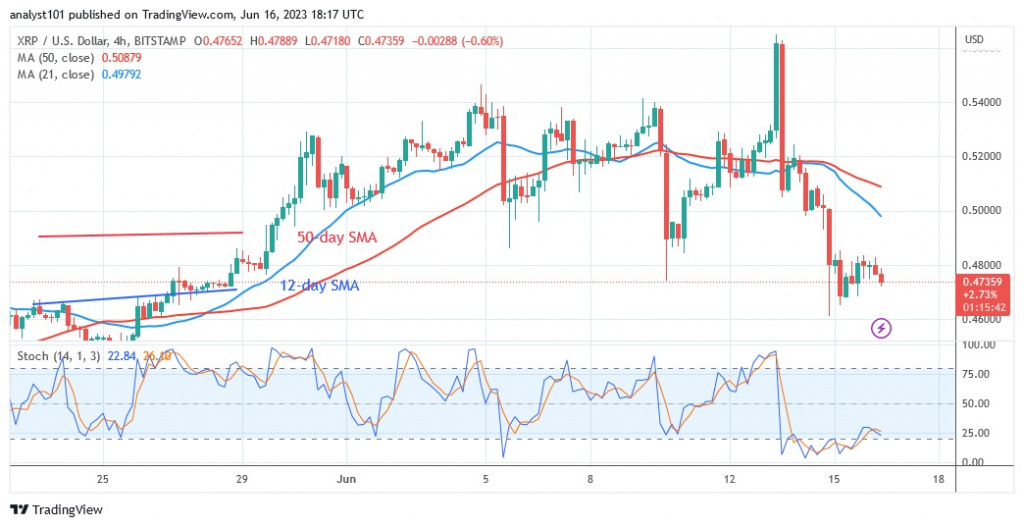
According to the Relative Strength Index for the 14 period, XRP has fallen to the 39 level today. The cryptocurrency market is on the verge of being oversold. With price bars below the moving average lines, selling pressure is likely to increase. The oversold zone of the market for XRP has already been reached. The daily stochastic is currently below the 20 level.

Technical Indicators:
Key resistance levels - $0.80 and $1.00
Key support levels - $0.40 and $0.20
What is the next move for Ripple?
With a price target of $0.41, Ripple has started a downward movement again. The moving average lines have been broken to the downside by the bears, which opens the door for a retest of the previous low at $0.41. The altcoin is currently oversold, so selling pressure is likely to ease in the meantime.

Disclaimer. This analysis and forecast are the personal opinions of the author and are not a recommendation to buy or sell cryptocurrency and should not be viewed as an endorsement by CoinIdol. Readers should do their own research before investing in funds.
News
Price
News
Price

(0 comments)