Quant Revises Low Of $104 And Faces Rejection At $116
Updated: Apr 30, 2023 at 11:59

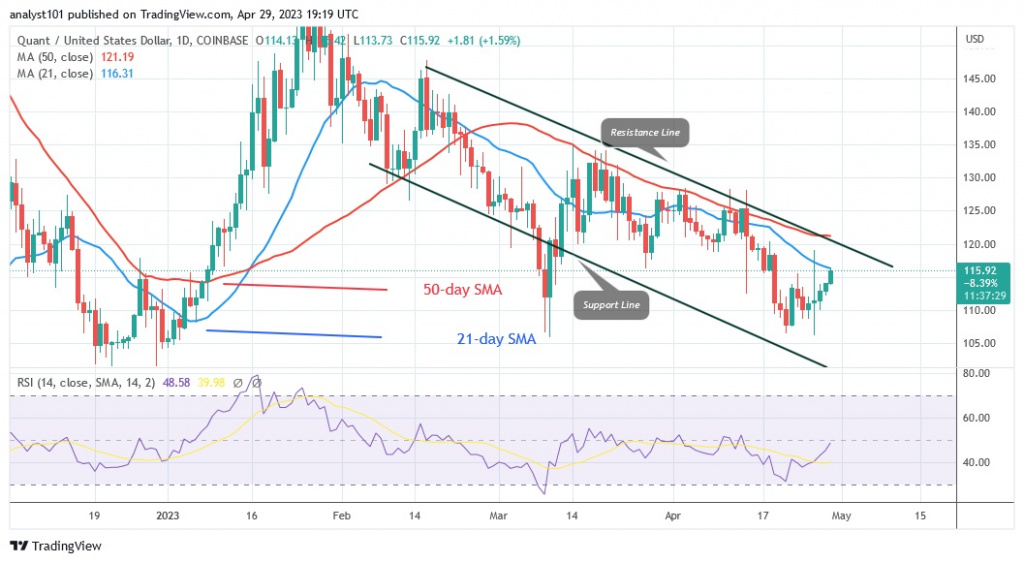
The price of Quant (QNT) is falling below the moving average lines, but has started to rise.
Quant long-term price forecast: bearish
The rising movement is stopped either below the $116 high or the 21-day line SMA. Also, QNT/USD is currently trading at $116. The uptrend will continue if the price rises above the moving average lines. The altcoin will rise and reach a maximum of $132. However, if the cryptocurrency is rejected at the current high, the market will fall. The value of the crypto asset will fall and reach the low of $108 again or $104 as the previous low. The altcoin has grown and is now retesting the overbought area of the market, which could lead to a decline.
Quant price indicator analysis
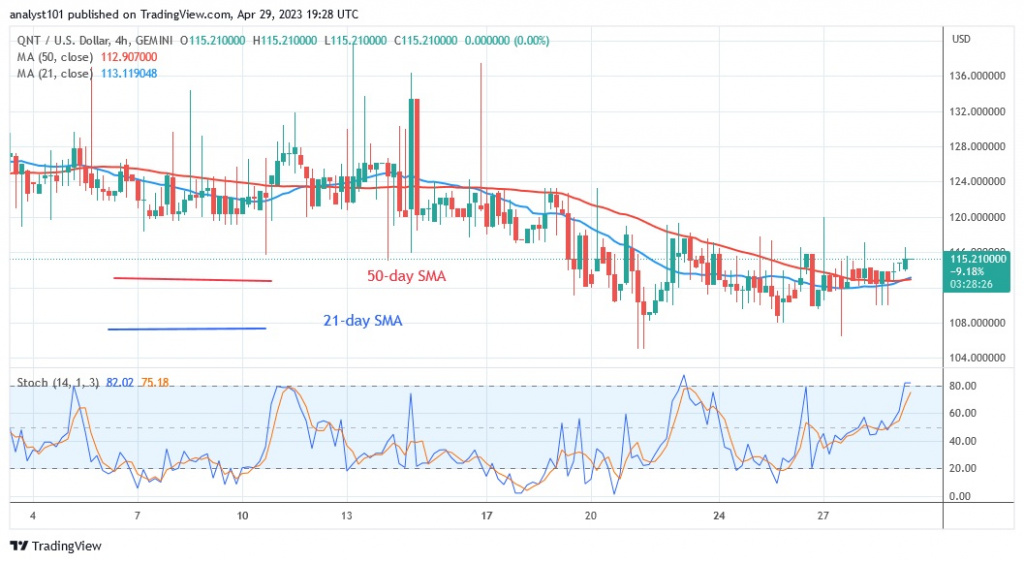
Quant's Relative Strength Index is at 45 for the 14 period, and despite the upside reversal, the altcoin continues to move in a bearish direction. When the price bars are below the moving average lines, the cryptocurrency will fall. QNT has climbed above the daily stochastic level of 80 today. This indicates that the altcoin is overbought and could fall.

Technical indicators
Key supply zones: $140, $150, $160
Key demand zones: $120, $110, $100
What is the next step for Quant?
QNT/USD's jump above the $116 high indicates an overbought sector of the market. In addition to the overbought condition, the wicks of the candles are moving towards previous highs. The wicks of these candles show strong selling pressure at higher price levels. However, the recent high rejects the current upward movement.

Disclaimer. This analysis and forecast are the personal opinions of the author and are not a recommendation to buy or sell cryptocurrency and should not be viewed as an endorsement by CoinIdol. Readers should do their own research before investing in funds.
Price
Price
Price
News
Price

(0 comments)