Coinidol.com: Cardano’s Price Falls Above Its $0.380 Range
Cardano's (ADA) price has resumed its bullish ascent, rising above the moving average lines.
ADA price long-term forecast: bullish
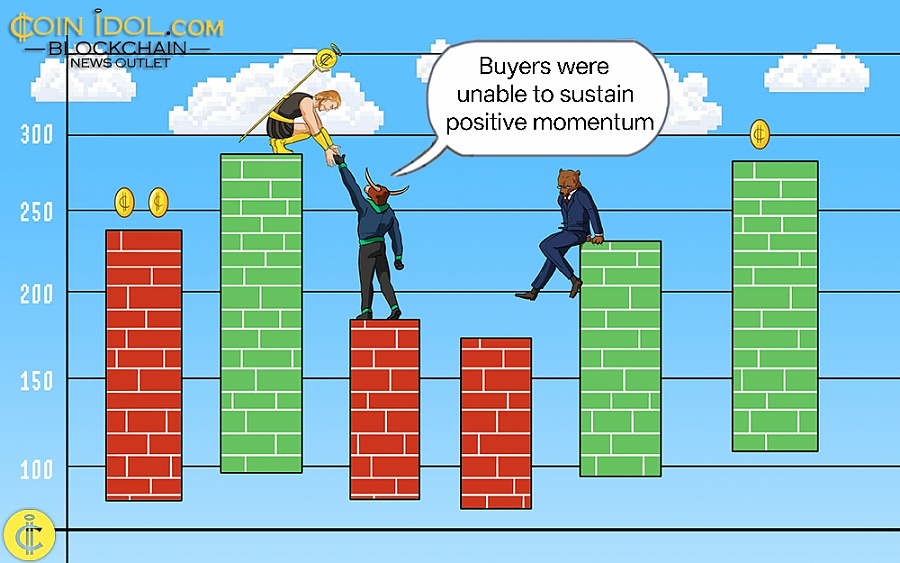
The upward trend peaked at $0.437 before reversing. Buyers were unable to sustain positive momentum above the $0.44 high, resulting in a decline. This rejection will cause the altcoin to trade within a narrow range above the 50-day SMA support but below the $0.44 barrier.
On the downside, if bears push the price below the 50-day SMA support, Cardano may fall to a level above the 21-day SMA support, or $0.37. Subsequently, bearish momentum could drive the price down to the previous low of $0.329.
However, if the 21-day SMA support holds, ADA will remain trapped between the moving average lines. Currently, ADA is at $0.388.
Technical Indicators
-
Key Resistance Zones: $1.20, $1.30, and $1.40
-
Key Support Zones: $0.90, $0.80, and $0.70
Cardano price indicators analysis
The cryptocurrency price, previously above the downward-moving average lines, has now dropped between them. The decline will resume if the price falls below the moving average lines. On the 4-hour chart, the price bars are positioned between the upward-sloping moving average lines. When either the 21-day or 50-day moving average is breached, ADA will establish a new trend.
 - JAN.08, 2026")
What is the next move for Cardano?
Cardano's bullish scenario has been invalidated, as the altcoin faces rejection at the $0.44 high. On the 4-hour chart, negative momentum has pushed the price below the moving average lines, but it has since stabilised above the 50-day SMA support. If the 50-day SMA support is breached, the ADA price would fall to its prior low of $0.33. In the meantime, the cryptocurrency price remains trapped within its range.
 - JAN.08, 2025")
Disclaimer. This analysis and forecast are the personal opinions of the author. The data provided is collected by the author and is not sponsored by any company or token developer. This is not a recommendation to buy or sell cryptocurrency and should not be viewed as an endorsement by Coinidol.com. Readers should do their research before investing in funds.
News
Price
Price
Coin expert
Price

(0 comments)