Quant Recovers As It Recaptures Key Support Above $100
Updated: May 08, 2024 at 14:06

The price of Quant (QNT) is in a sideways trend, with the decline halted above the $91.50 support. QNT price analysis by Coinidol.com.
Long-term quant price prediction: range
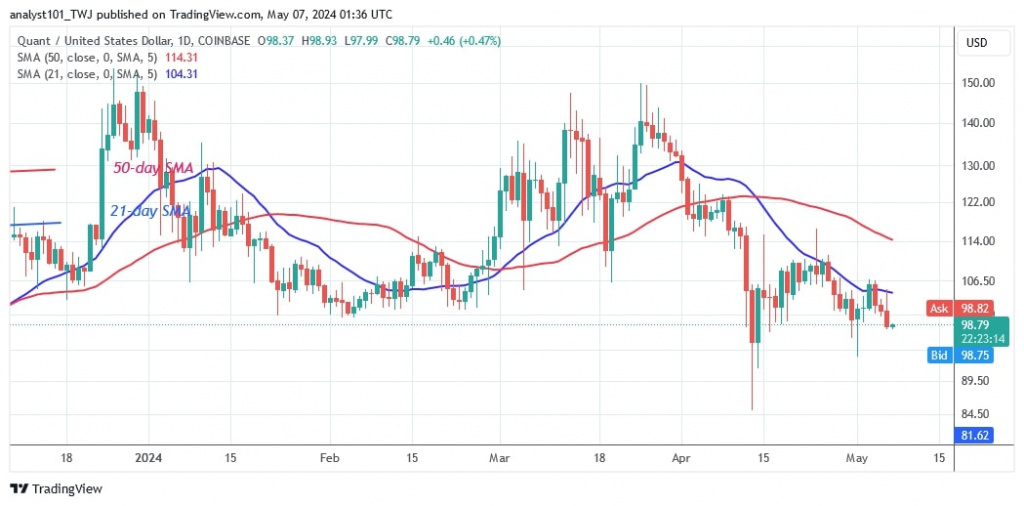
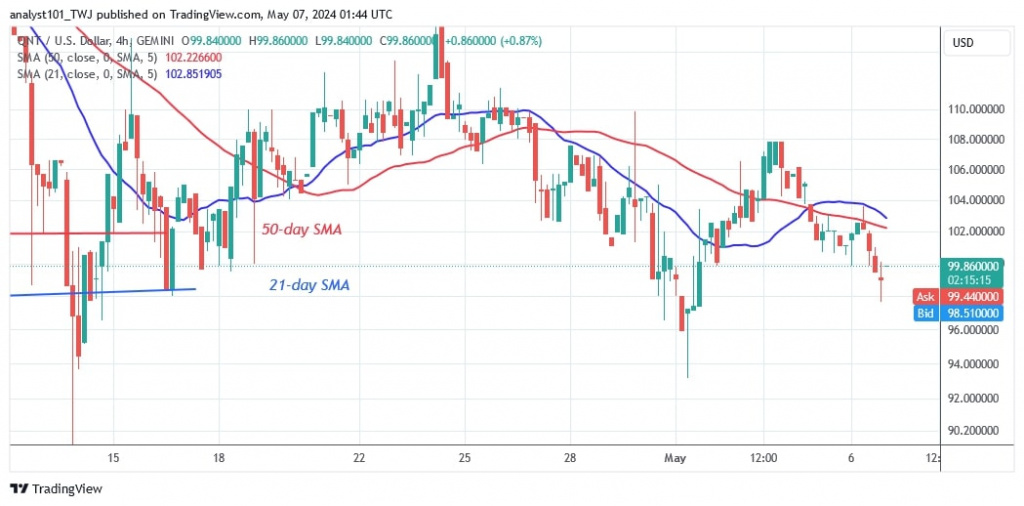
The altcoin's price range has been between $91.50 and $105.50 since April 14, 2024. On May 1, the altcoin hit a low of $93.44, but the bulls bought the dips. QNT took an upward correction to a high of $106 but was rejected at the recent high. The 21-day SMA continues to limit the upside. QNT is now worth $97.96.
On the downside, extended candlestick tails suggest significant buying pressure at lower prices. On the upside, the altcoin will resume its uptrend if it recovers and breaks the 21-day SMA resistance. In the meantime, the altcoin is rallying to reclaim its key support above $100.
Analysing the quant price indicators
The price bars remain below the 21-day SMA, suggesting that QNT could fall further. The 21-day SMA limits the cryptocurrency's upside. The moving average lines have formed a bearish crossover. The altcoin is in a downtrend, although selling pressure has always been halted above the $100 support.
Technical indicators
Important supply zones: $140, $150, $160
Important demand zones: $90, $80, $70

What is the next development for Quant?
Quant is currently trading in a range above the $91.50 support. The altcoin has been trading below the 21-day SMA resistance line but above the $91 support for the past two weeks. The sideways trend will be over if the resistance line is broken. The bulls have defended their current support of $91.

Disclaimer. This analysis and forecast are the personal opinions of the author and are not a recommendation to buy or sell cryptocurrency and should not be viewed as an endorsement by CoinIdol.com. Readers should do their research before investing in funds.
News
Coin expert
News
Price
Price

(0 comments)