Quant Reaches Bearish Exhaustion As It Recovers Over $100

Quant's (QNT) rally has stalled as the price has risen above the key $100 support level.
Long-term price forecast for Quant: bearish
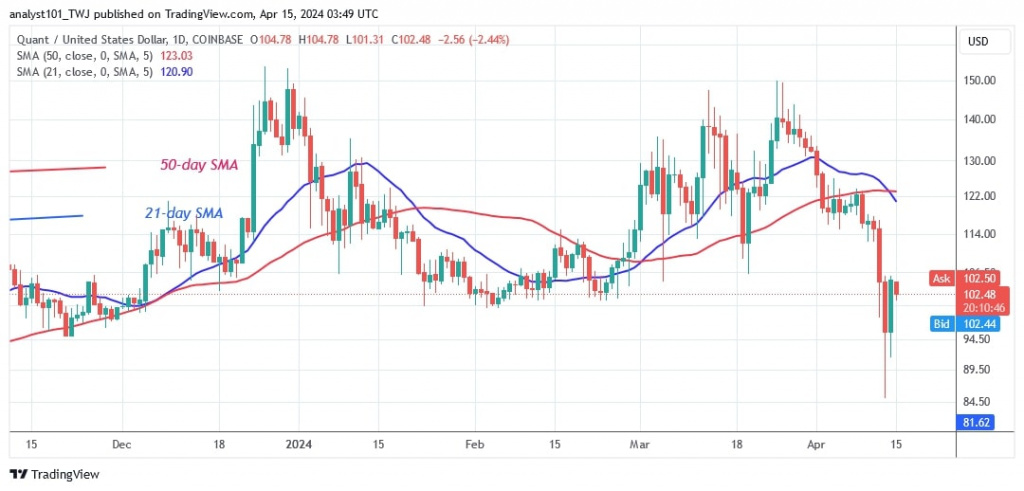
In the latest market move, QNT rose to the $150 resistance zone on March 26, 2024 but was rejected. The altcoin faced a fierce rejection and quickly plunged to a low of $85.
On the flip side, the bulls bought the dips as the market rallied above the $100 support. The bearish momentum has calmed down as the altcoin's price hovers between $90 and $122. QNT will resume its uptrend once it rises above the moving average lines or resistance at $122.
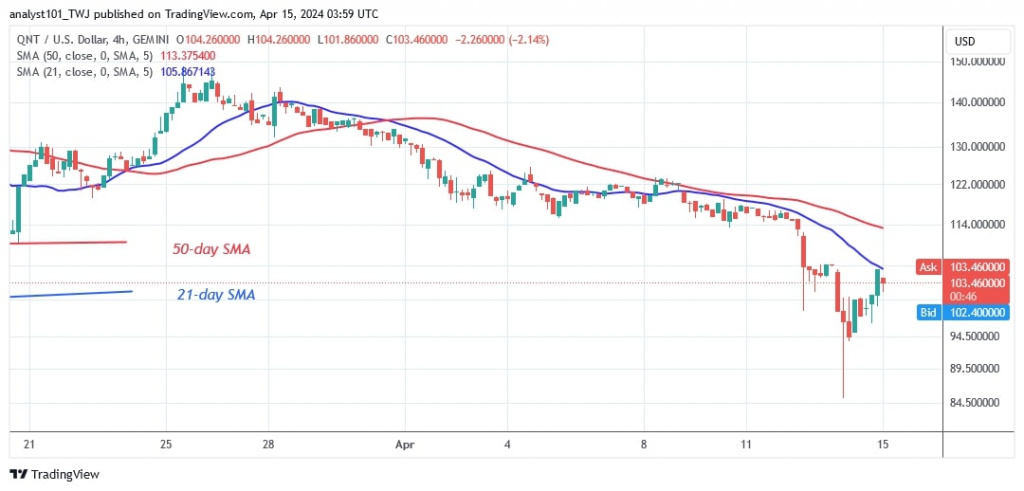
On the downside, a long candlestick tail signals strong buying above the $85 support level. QNT is trading at $100 at the time of publication.
Analysis of the Quant price indicator
The price bars are falling below the horizontal moving average lines. QNT has been in a sideways trend since December 26, 2023, with buyers failing to sustain the price above the $150 resistance level. QNT also has a bearish crossover that occurs when the 21-day SMA crosses below the 50-day SMA, which is a negative signal.
Technical Indicators
Important supply zones: $140, $150, $160
Important demand zones: $90, $80, $70

What is the next development for Quant?
After its recent dip, QNT has recovered above the key support level of $100. The altcoin is trading in the bearish trend zone, albeit within a small range. The altcoin is correcting upwards, although it is facing initial resistance at $105. The current price range of the altcoin is between $90 and $122.

Disclaimer. This analysis and forecast are the personal opinions of the author and are not a recommendation to buy or sell cryptocurrency and should not be viewed as an endorsement by CoinIdol.com. Readers should do their research before investing in funds.
Price
Price
Price
Price
Price

(0 comments)