Quant Price Recovers Above $119 Support

The price of Quant (QNT) is struggling to recover from its downtrend. QNT price analysis by Coinidol.com.
Long-term quant price prediction: bullish
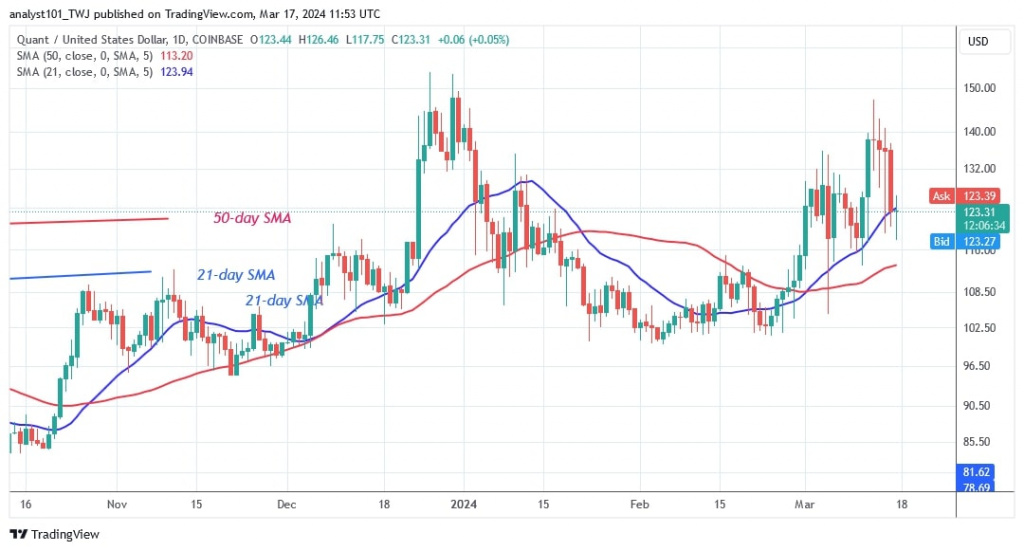
The cryptocurrency reached a high of $130 on March 1, 2024. However, the last high was a limit to the uptrend. The bulls broke through resistance at $130 and reached a high of $147.47 before being rejected on March 13. The wicks of the candles at the high indicate significant selling pressure at these price levels.
If the bulls are successful, the altcoin will retest its previous high of $153.83. Quant has fallen and returned to its original range, which is above the moving average lines and resistance at $130. On the other hand, if the bears break below the moving average lines, QNT will fall and return to its previous low of $101. At the time of writing, it is trading at $123.52.
Analysis of the Quant price indicators
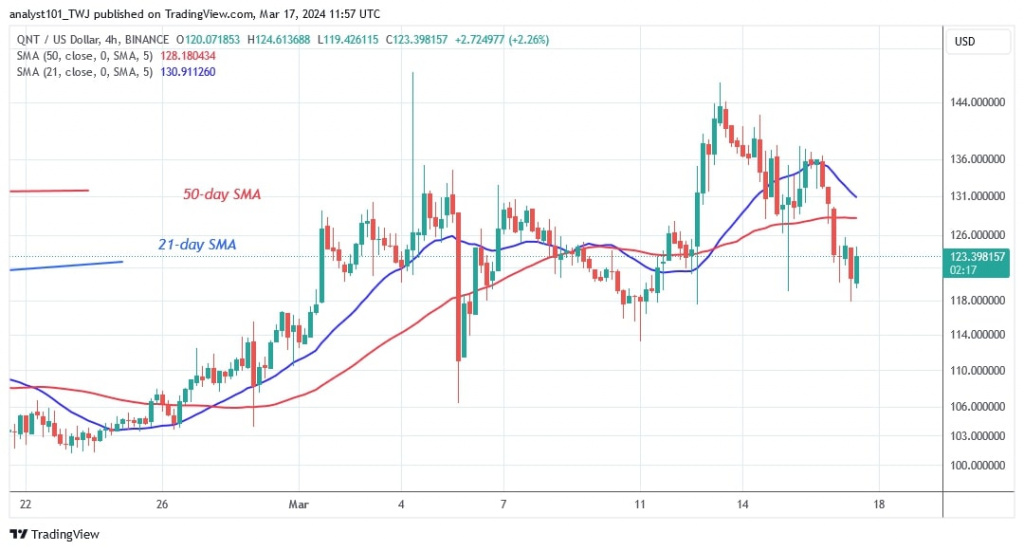
After the dramatic drop, QNT has fallen above the moving average lines. The bulls have stopped the slide above the 21-day SMA. The 21-day SMA acts as a support line for the cryptocurrency. On the 4-hour chart, the price bars are falling below the moving average lines. The altcoin has found support above the $119 level.
Technical indicators
Important supply zones: $140, $150, $160
Important demand zones: $90, $80, $70

What's next for Quant?
QNT is now trading in a range after its recent decline. The altcoin is now trading in the price range of $118 to $144. The cryptocurrency will rally if it stays above the moving average lines of the daily chart. The bulls and bears are currently trying to stay above the 21-day SMA.

On March 11 Coinidol.com reported that the bulls bought the dips as the altcoin climbed back above the moving average lines and QNT was $121.23.
Disclaimer. This analysis and forecast are the personal opinions of the author and are not a recommendation to buy or sell cryptocurrency and should not be viewed as an endorsement by CoinIdol.com. Readers should do their research before investing in funds.
News
Coin expert
News
Price
Price

(0 comments)