Quant Meets With Rejection At $97 And Continues His Ascent
Updated: Jun 04, 2024 at 11:01

The price of Quant (QNT) has fallen and resumed consolidation above support at $91.50. Price analysis by Coinidol.com.
Long-term forecast for Quant price: bearish
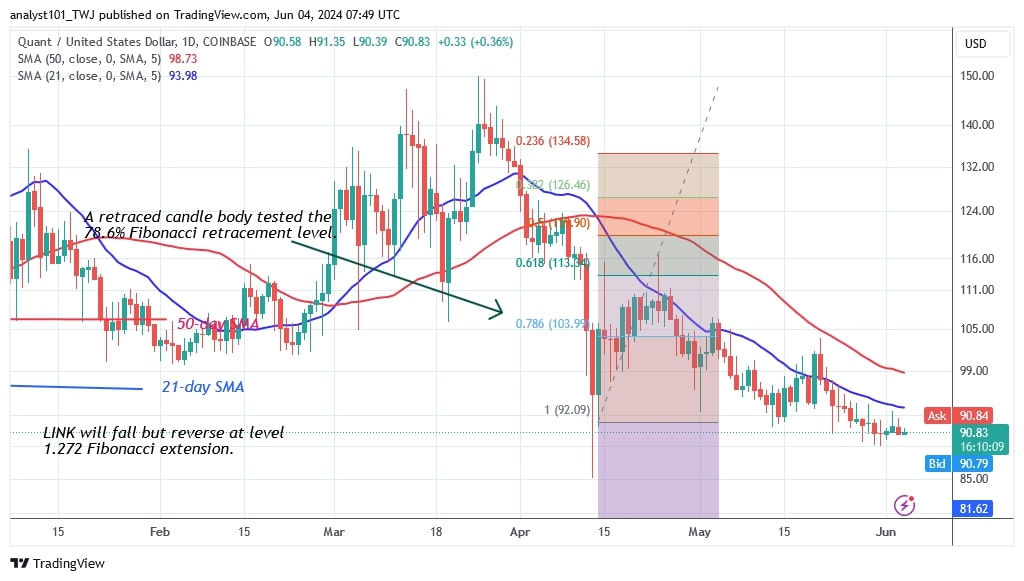
On May 20, the altcoin rose above the moving average lines but was pushed back by the 50-day SMA. Negative momentum has undercut the 21-day SMA and the current support at $91.50. The altcoin will attempt to retest the previous low of $85.13. However, the price indication foresees a further decline in the cryptocurrency.
On the April 13 price drop, the altcoin corrected upwards and tested the 78.6% Fibonacci retracement line with a retracing candlestick body. The correction showed that Quant will continue to decline before reversing at the 1.272 Fibonacci extension or $76.96. At the time of writing, QNT is now worth $90.93.
Analysing the Quant Price indicators
Quant is bearish after the recent rejection of the 21-day SMA. The price bars have encountered resistance at the 21-day SMA. Every time the altcoin is rejected at the moving average lines, it loses value. The price movement is delayed due to the presence of doji candlesticks.
Technical indicators
Important supply zones: $140, $150, $160
Important demand zones: $90, $80, $70

What is the next development for Quant?
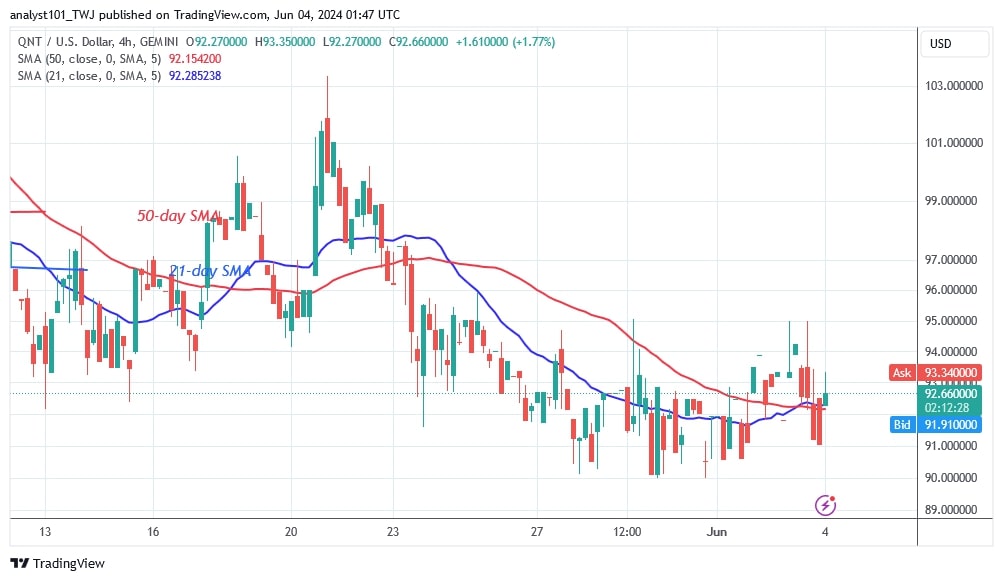
The price forecast and the moving average indicate that the altcoin will continue to decline. The moving average lines have put the brakes on the uptrend. Today, the altcoin shot up and broke through its moving averages on the 4-hour chart. The altcoin came under heavy selling pressure near the $97 mark and quickly plunged. The signal for the cryptocurrency is still negative as it is trading in the bearish trend zone.

Disclaimer. This analysis and forecast are the personal opinions of the author and are not a recommendation to buy or sell cryptocurrency and should not be viewed as an endorsement by CoinIdol.com. Readers should do their research before investing in funds.
News
Coin expert
News
Price
Price

(0 comments)