Quant Declines As It Recovers Its Previous Low At $105

Quant (QNT) has been declining and may continue to do so.
Quant long-term price forecast: declining
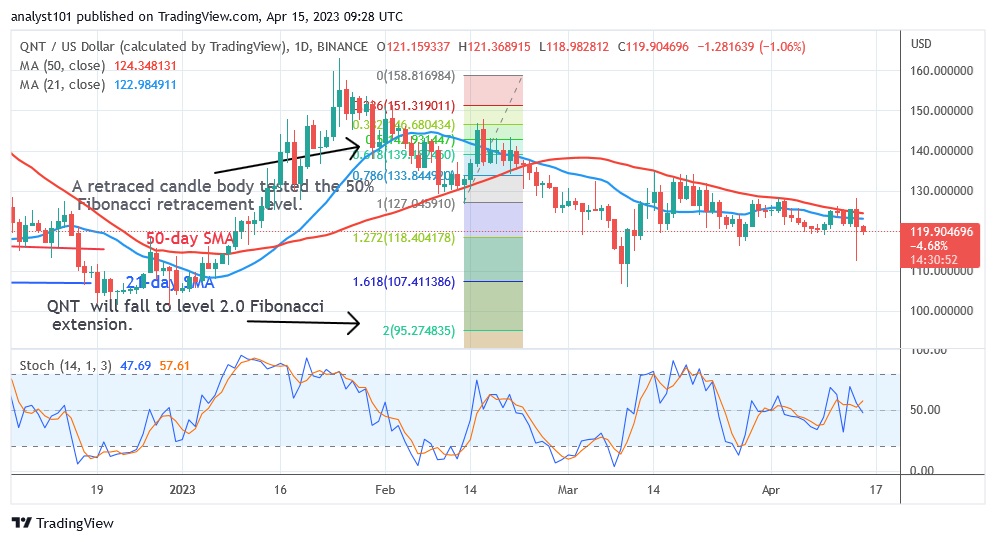
Since March 10, buyers have attempted to hold the price above the moving average lines but have been thwarted by the $130 barrier. After repeated rejections, the cryptocurrency's price has dropped below the moving average lines. QNT is currently trading at $119 but could fall further. The decline could go back to the previous low at $105. The market will continue to fall if the current support is broken. On February 13, QNT made an upward correction and a candlestick tested the 50% Fibonacci retracement level. The correction implies that QNT will fall to the 2.0 Fibonacci Extension level or $95.27. In the meantime, QNT is in a downtrend towards the current support.
Quant price indicator analysis
The cryptocurrency is in a bearish trend zone and could fall further. Another reason is that the price bars are below the moving average lines. Quant is in a bearish momentum below level 50 of the daily stochastic. During period 14, QNT is at a Relative Strength Index level of 42.

Technical indicators
Key supply zones: $140, $150, $160
Important demand zones: $120, $110, $100
What is the next move for Quant?
Quant is sliding on the 4-hour chart as a result of the barrier above $128. The altcoin is currently losing support and dropping to its previous level. The cryptocurrency asset will resume its uptrend if the existing support holds.

Disclaimer. This analysis and forecast are the personal opinions of the author and are not a recommendation to buy or sell cryptocurrency and should not be viewed as an endorsement by CoinIdol. Readers should do their own research before investing in funds.
Price
Price
Price
News
Price

(0 comments)