Quant Continues To Fall But Pauses Above $72
Updated: Jun 28, 2024 at 13:39

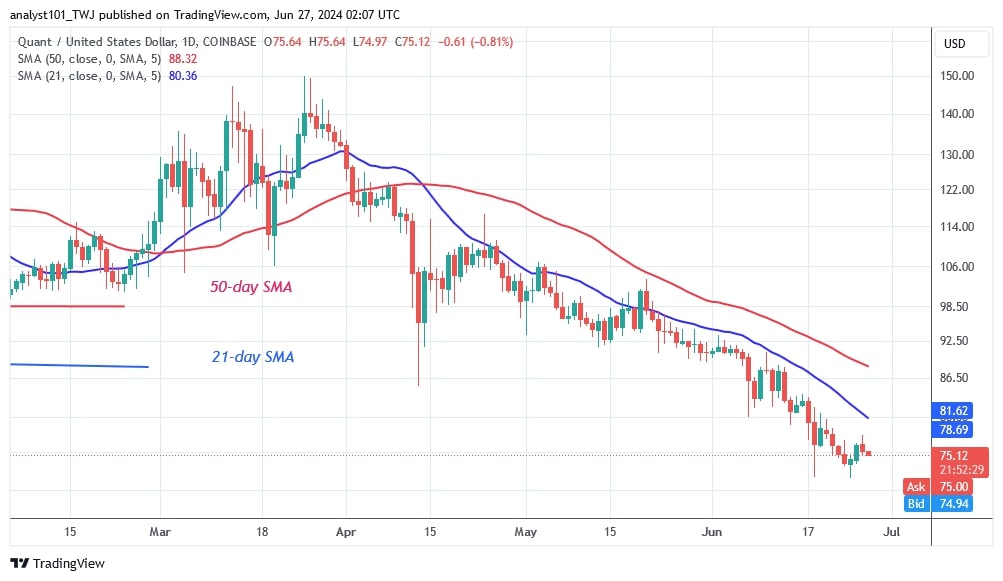
The price of Quant (QNT) has been downgraded in the last three months. According to the price forecast, selling pressure is expected to reach a low of $67.
Long-term price forecast for Quant: bearish
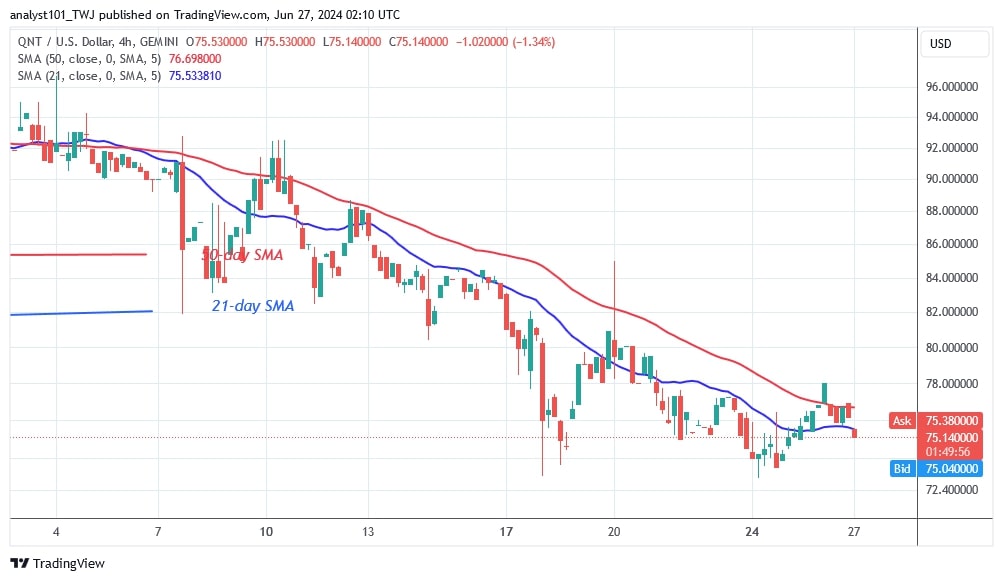
However, on June 18, the decline eased and the cryptocurrency reached a low of $72. The altcoin has formed a range between the $72 support and the moving average lines or resistance at $80. Quant has been trading in a tight range over the past week, according to price analysis by Coinidol.com.
The altcoin will fall to the projected price of $67 if the current support is broken. Quant will resume its uptrend if it rises above the current support. The altcoin will trend above its moving average lines. The cryptocurrency is now worth $75.11 at the time of writing.
Analysing the quant price indicators
The moving average lines are trending south, indicating a downturn. On the 4-hour chart, the price bars are breaking through the moving average lines but are being repelled by them. The price movement has remained constant due to the dominance of the doji candlesticks.
Technical indicators
Important supply zones: $140, $150 $160
Important demand zones: $90, $80, $70

What is Quant's next move?
Quant has stayed within its range after the price drop on June 18. The altcoin traded between $72 and $78. On June 20, the altcoin rallied and broke out above the moving average lines but was rejected at a high of $85. The range-bound movement will continue as long as the existing support holds.

Coinidol.com reported previously that on June 18, 2024, the downtrend continued as the altcoin fell to a low of $72. QNT fell to a low of $72, but was fluctuating above the support again.
Disclaimer. This analysis and forecast are the personal opinions of the author. They are not a recommendation to buy or sell cryptocurrency and should not be viewed as an endorsement by CoinIdol.com. Readers should do their research before investing in funds.
Price
News
Price
News
Price

(0 comments)