Quant Dips Into Oversold Territory And Approaches $93 Low
Updated: May 21, 2023 at 09:43

The price of Quant (QNT) has continued to fall as it meets resistance at the 21-day line SMA.
Quant long term price forecast: bearish
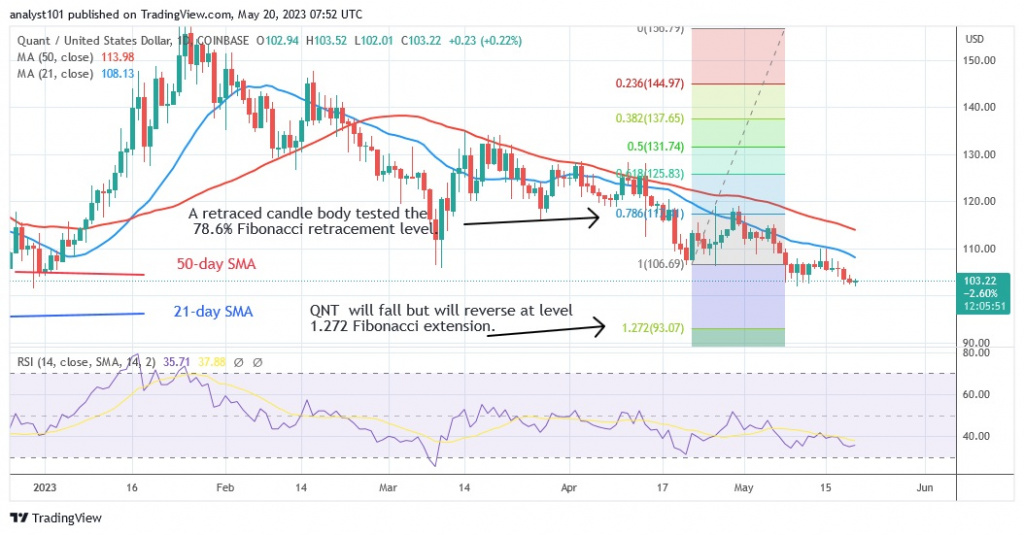
As it approaches the oversold zone, the crypto asset value has dropped drastically. QNT is currently trading for $103.24. The moving average lines have proven to be a resistance to the price increase since the beginning of the decline. The price signal suggested that the cryptocurrency would continue to fall and could even reverse. QNT had an upward correction during the downturn on April 22, and a candlestick tested the 78.6% Fibonacci retracement level. The correction predicts that QNT will decline, but that it will reverse at the Fibonacci extension at $1.272 or $93.07. QNT's price has fallen slightly and is at a low of $103 at the time of writing.
Quant price indicator analysis
The relative strength index for the cryptocurrency is at 35 for the 14 period, and QNT has continued to fall in the bearish trend zone. With the price bars below the moving average lines, the cryptocurrency is vulnerable to a decline. Meanwhile, the moving average lines are pointing downwards, indicating a downturn. The Doji candle has slowed down the price movement.

Technical indicators
Key supply zones: $140, $150, $160
Key demand zones: $120, $110, $100
What is the next move for Quant?
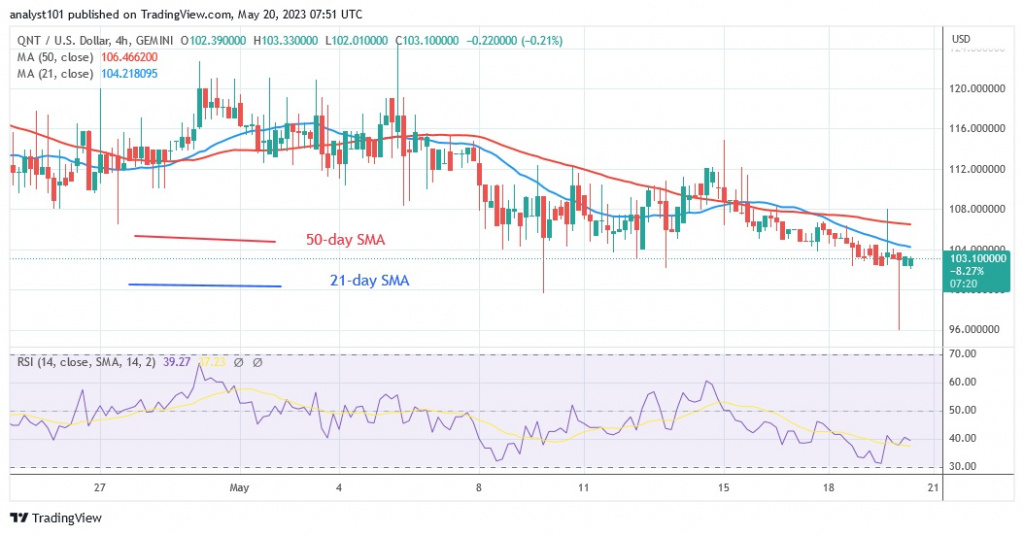
The price of QNT/USD is falling after breaking the support of $102. The price indicator predicts that the downward trend of the cryptocurrency will continue. However, the price movement has slowed down due to the Doji candlesticks.

Disclaimer. This analysis and forecast are the personal opinions of the author and are not a recommendation to buy or sell cryptocurrency and should not be viewed as an endorsement by CoinIdol. Readers should do their own research before investing in funds.
Price
Price
Price
News
Price

(0 comments)