Polygon Is In A Downtrend And Heading For $0.54
Updated: May 09, 2023 at 17:19

Polygon (MATIC) has fallen below the moving average lines.
Polygon price long-term forecast: bearish
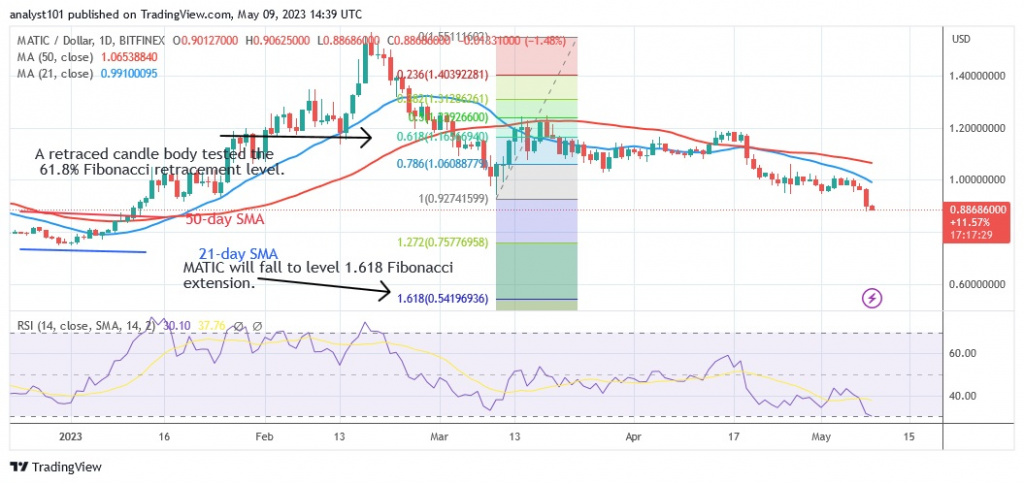
The presence of indecisive candles with small bodies known as Doji has caused MATIC to decline somewhat. The bearish trend is quite slow. The altcoin has fallen and broken the current support level of $0.94. At the time of writing, Polygon is trading at $0.88. The price signal suggests that cryptocurrencies will continue to fall. MATIC made an upward correction on March 10, and the candlestick tested the 61.8% Fibonacci retracement level. The adjustment predicts that MATIC will continue to fall to a low of $0.54. Meanwhile, the altcoin is sliding as it approaches the oversold area of the market.
Polygon indicator analysis
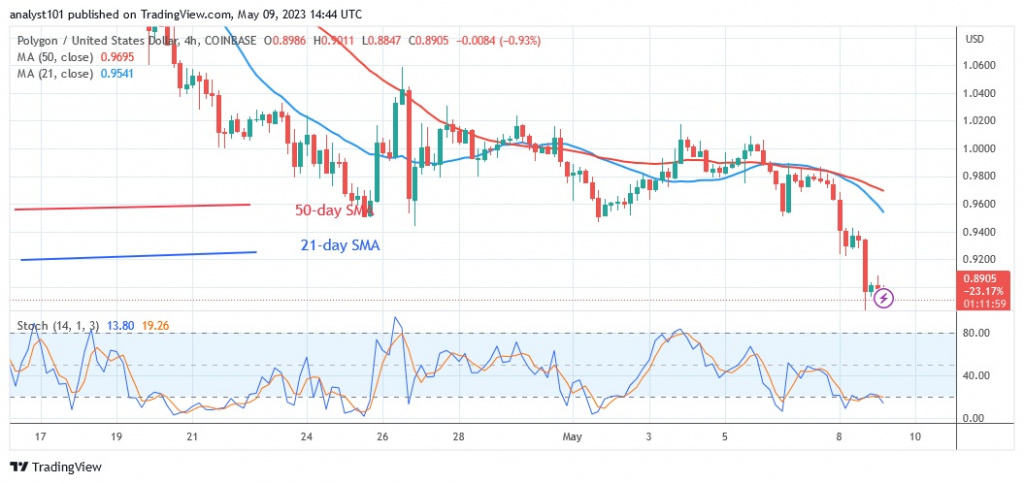
The Polygon indicator is approaching the Relative Strength Index level 30 for the period 14 and declining. The oversold area of the market has been reached by the current decline. The bear market is near its end. The moving average lines are below the price bars, causing the altcoin to decline. The oversold area of the market has been reached by the MATIC. The daily stochastic is currently below the level of 20.

Technical indicators
Resistance levels: $1.20, $1.30, $1.40
Support levels: $1.00, $0.90, $0.80
What is the next step for Polygon?
If Polygon breaks the current support, it will continue its downtrend. It is currently in the oversold area of the market. It is likely that the downtrend will come to a halt soon. It is likely that buyers will emerge in the oversold area to push the price up.

Disclaimer. This analysis and forecast are the personal opinions of the author and are not a recommendation to buy or sell cryptocurrency and should not be viewed as an endorsement by CoinIdol. Readers should do their own research before investing in funds.
News
News
Coin expert

(0 comments)