Polkadot Recovers And Retakes Resistance At $4.69

Polkadot (DOT) is in a downtrend and approaching the bottom of the chart.
Polkadot price long term analysis: bearish
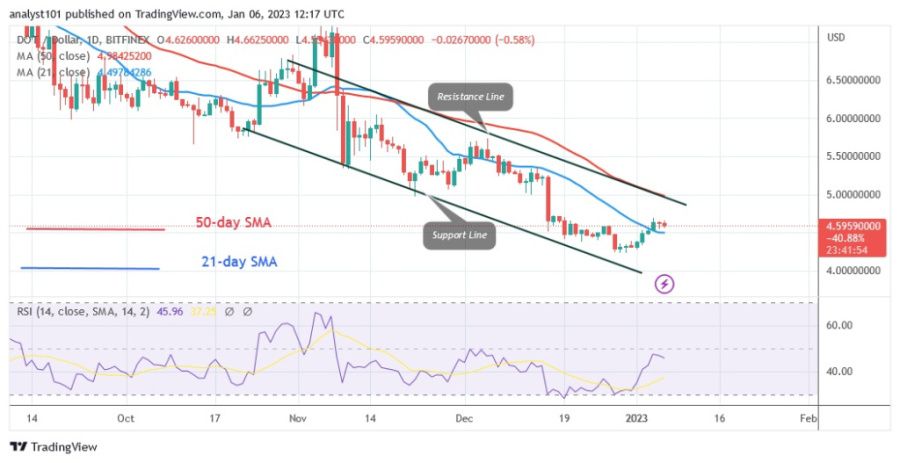
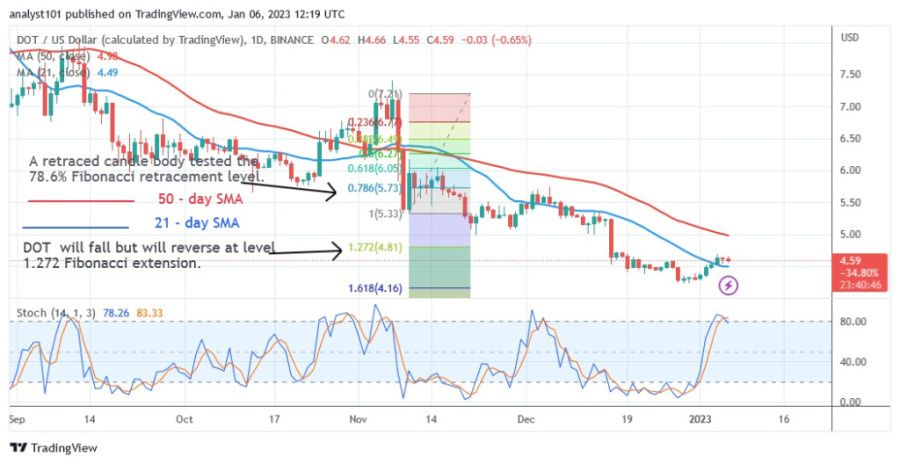
Since December 28, buyers have protected the current support level of $4.25. The value of the cryptocurrency asset has been rising over the past week. The 21-day line SMA was crossed, but the 50-day line SMA was not crossed by the bullish momentum. A break above the 50-day simple moving average will push the altcoin to its previous high of $7.00. The current bullish momentum has stalled at the $5.00 resistance level. However, if the altcoin finds support above the 21-day moving average line, it will likely resume its move between the moving average lines. If the bears break below the 21-day SMA line, the price of DOT will fall to the previous low of $4.25. In the meantime, the altcoin fluctuates between the moving average lines. When the moving average lines are broken, the altcoin will develop a trend.
Polkadot indicator analysis
The Relative Strength Index is at 45 for period 14. After the recent upward correction, DOT has entered the bearish trend zone. Polkadot will be forced to move in a range as it is between the moving average lines. The cryptocurrency has reached the overbought zone of the daily stochastic, which is above the level of 80. This means that sellers will emerge in the overbought area and drive prices down. The 21-day and 50-day SMAs are sloping downward, indicating a downtrend.

Technical indicators:
Key resistance levels - $10 and $12
Key support levels - $6 and $4
What is the next direction for Polkadot?
Polkadot is currently trading at the bottom of the chart, and the $4.25 level that acted as support is still in effect. If the cryptocurrency is rejected at its recent high, it will likely fall. If it overcomes the initial resistance at $4.69, it will rally above the 50-day line SMA.

Disclaimer. This analysis and forecast are the personal opinions of the author and are not a recommendation to buy or sell cryptocurrency and should not be viewed as an endorsement by CoinIdol. Readers should do their research before investing in funds.
Price
Coin expert
Price
Coin expert
Price

(0 comments)