Litecoin Continues Its Upward Trend and Sets Its Sights on The High at $180

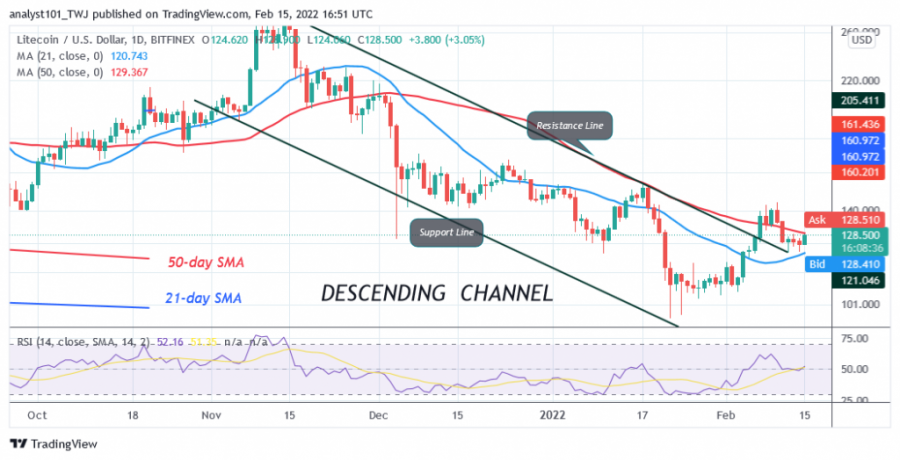
Litecoin (LTC) price is stuck between the moving averages. The previous uptrend ended at the high of $144 when the altcoin fell below the 50-day moving average.
The cryptocurrency is now trading above the 21-day line but below the 50-day line, which means that the LTC price will move between the moving averages.
Long-term forecast for the Litecoin price: Bullish
Litecoin will develop a trend when the moving average lines are broken. Today, LTC/USD is trading at $128 at the time of writing. If the price rises above the current support, the bulls will try to break the 50-day moving average line and the high at $140. If the bulls are successful, the market will reach a high of $180. However, price volatility will continue if the bullish scenario is invalidated.
Litecoin indicator analysis
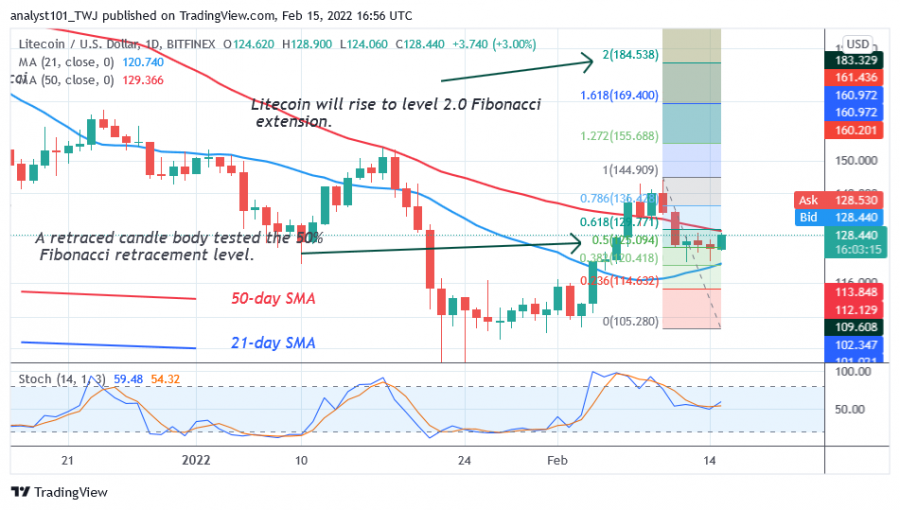
The LTC price bars are between the moving averages, indicating a possible range-bound move. The altcoin is above the 50% area of the daily stochastic. This suggests that the market has resumed its bullish momentum. Litecoin is at the 52 level of the Relative Strength Index for period 14. The cryptocurrency is trading in the uptrend zone and is capable of another upward movement.

Technical Indicators:
Resistance levels: $240, $280, $320
Support levels: $200, $160, $120
What is the next step for Litecoin?
Litecoin is still in an uptrend as the price is rising above the moving averages. Meanwhile, the uptrend from February 10 has a candlestick body that tested the 50% Fibonacci retracement level. The retracement suggests that Litecoin will rise to the 2.0 Fibonacci extension level or the $184.53 high.

Disclaimer. This analysis and forecast are the personal opinions of the author are not a recommendation to buy or sell cryptocurrency and should not be viewed as an endorsement by CoinIdol. Readers should do their own research before investing funds.
Coin expert
Price
Coin expert
Price
Price

(0 comments)