Litecoin Trades In A Minimum Price Range Below $78
Updated: Jan 03, 2024 at 17:07

Litecoin (LTC) price has been in the positive trend zone since the breakout on December 26. The development of doji candlesticks has led to minimal price movement.
Litecoin price long term forecast: bullish
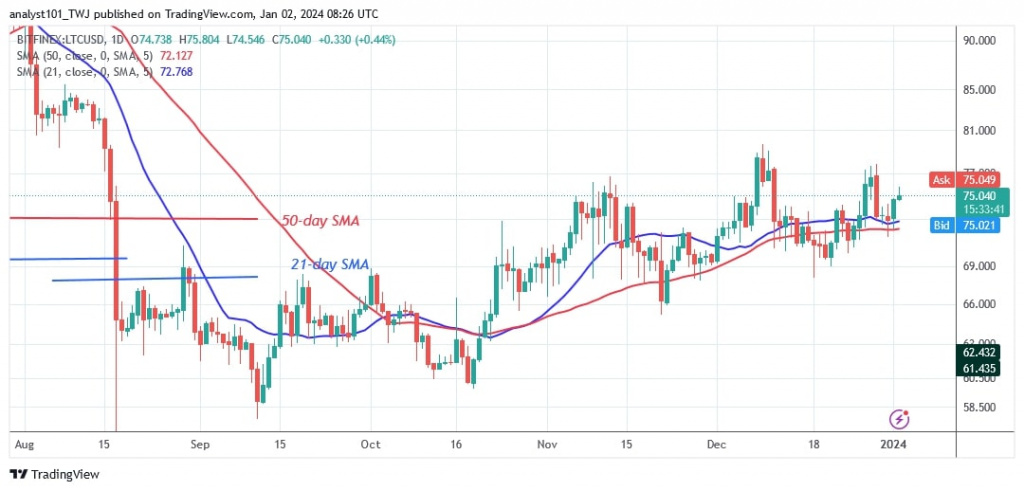
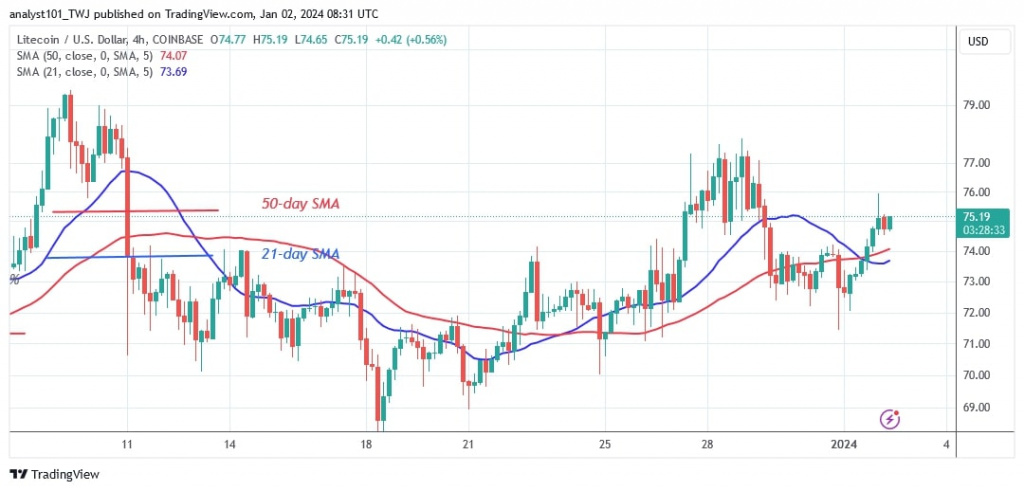
Litecoin has been trading in a narrow range between $70 and $78 over the past week. The upward movement was held back by resistance at $76 and $78.
However, if buyers break through these resistances, Litecoin will rise to a high of $83.
On the other hand, the market will continue to move horizontally between $70 and $76 if the resistances are not broken. Litecoin's price will fall if the bears break below the moving average lines or lose the current support at $70.
Analysing the Litecoin indicators
Litecoin's price bars are above the moving average lines, which keeps the altcoin in the uptrend zone. The cryptocurrency rises as long as the price bars remain above the lines that represent the moving average. The moving average lines are sloping horizontally due to the sideways trend that has been ongoing since August.
Technical indicators
Resistance levels: $100, $120, $140
Support levels: $60, $40, $20

What is the next move for Litecoin
Litecoin is rising as it trades above the moving average lines in a range. LTC/USD is in a range between $70 and $78 in the positive trend zone. If the altcoin loses the $70 support, it will return to the lowest price area. In other words, the altcoin will be forced to trade in the range between $60 and $70.

Disclaimer. This analysis and forecast are the personal opinions of the author and are not a recommendation to buy or sell cryptocurrency and should not be viewed as an endorsement by CoinIdol.com. Readers should do the research before investing in funds.
Price
Price
Price
Price
News

(0 comments)