Litecoin Consolidates Between $172 and $186 as It Reaches Equilibrium

Litecoin (LTC) price is trading at $179 at the time of writing. The price movement is stagnating due to the emergence of candlesticks with small bodies called doji and spinning tops. These candlesticks are responsible for the current sideways movement.
The candlesticks describe that buyers and sellers are undecided about the direction of the market. This is the reason for the price fluctuations. The current sideways movement will continue for a few more days as the RSI of period 14 indicates a balance between supply and demand.
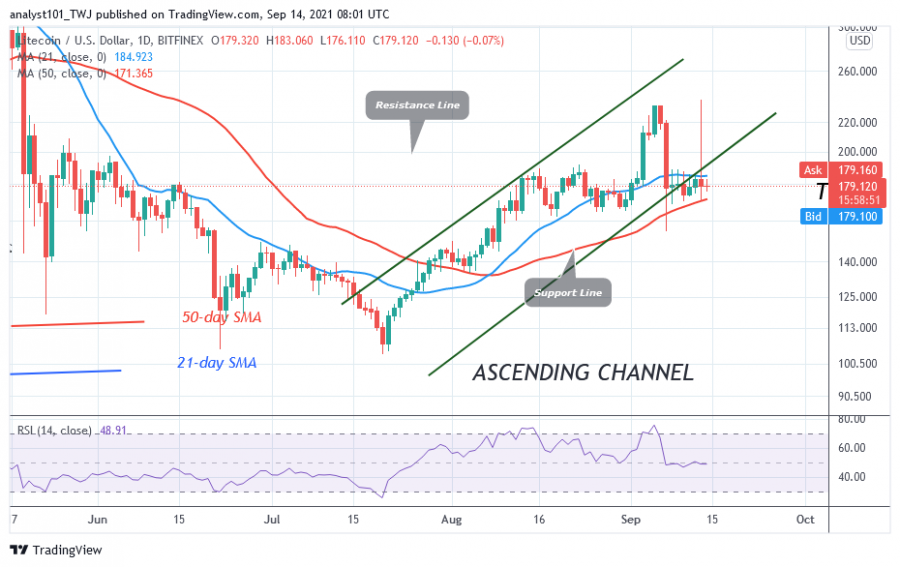
Currently, the LTC price is contained between the 21-day line SMA and the 50-day line SMA. If price breaks above the 21-day line SMA and bullish momentum continues, the uptrend will resume. If the price breaks below the 50-day line SMA and the downward momentum continues, the selling pressure will resume. Meanwhile, the LTC price is trading marginally in the range bound zone.
Litecoin indicator analysis
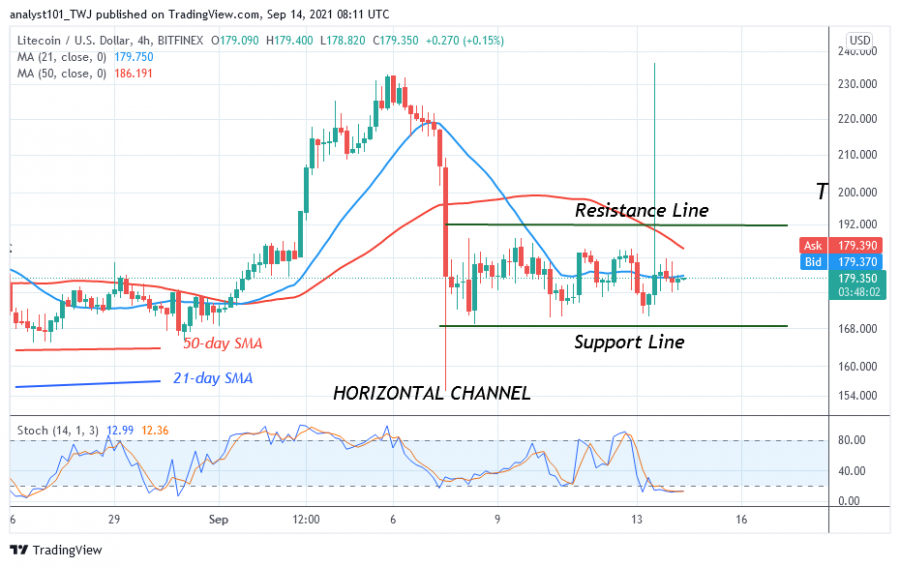
The LTC price is at the 49 level of the Relative Strength Index of period 14, indicating that the market has reached a balance between supply and demand. The LTC price has fallen below the 20% range of the daily stochastic. Litecoin is in the oversold region of the market. The altcoin will rise again when buyers appear in the oversold region.

Technical indicators:
Major Resistance Levels - $500 and $540
Major Support Levels - $180 and $140
What is the next move for Litecoin?
Litecoin is moving in a range between $168 and $192. Currently, LTC/USD is moving in a tight range between $172 and $186. The altcoin will move when the range is broken. Meanwhile, the altcoin is consolidating above the $170 support.

Disclaimer. This analysis and forecast are the personal opinions of the author are not a recommendation to buy or sell cryptocurrency and should not be viewed as an endorsement by CoinIdol. Readers should do their own research before investing funds.
Price
Coin expert
News
News
Price

(0 comments)