Litecoin Moves In Range, But Risks Drop To Low Of $73.09
Updated: May 02, 2023 at 13:44

The price of Litecoin (LTC) is falling as it deviates from the moving average lines.
Long-term forecast of Litecoin price: bearish
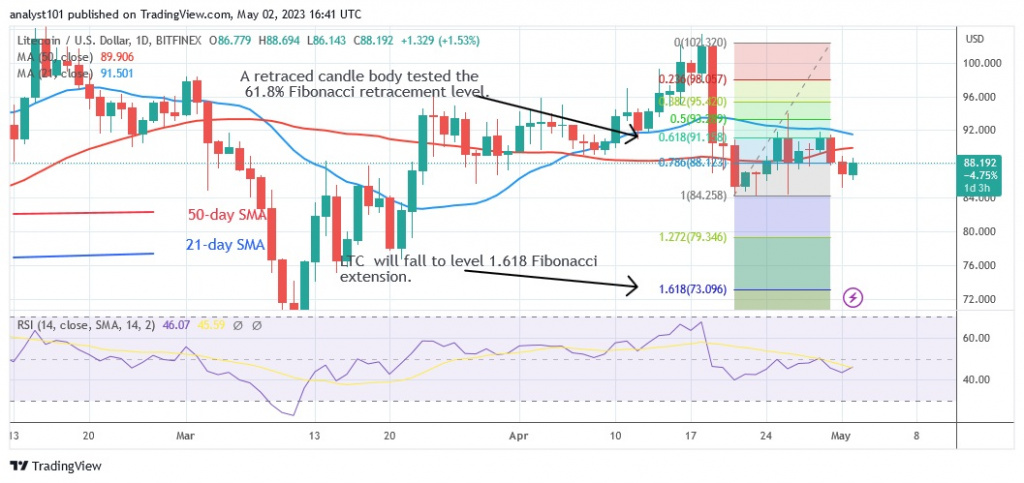
The cryptocurrency asset experienced an upward correction but was unable to cross the moving average lines. Buyers tried to keep the price above the $92 resistance on April 25 and 29, but they failed to do so. As LTC approaches its previous low of $84, its price has fallen. Selling pressure will increase if the price falls below the current support level of around $84. During the decline on April 21, Litecoin experienced an upward correction and a retreating candlestick tested the 61.8% Fibonacci retracement level. The price of LTC will fall around the adjustment to the 1.618 Fibonacci extension level, or $73.09 Litecoin.
Analysis of Litecoin indicators
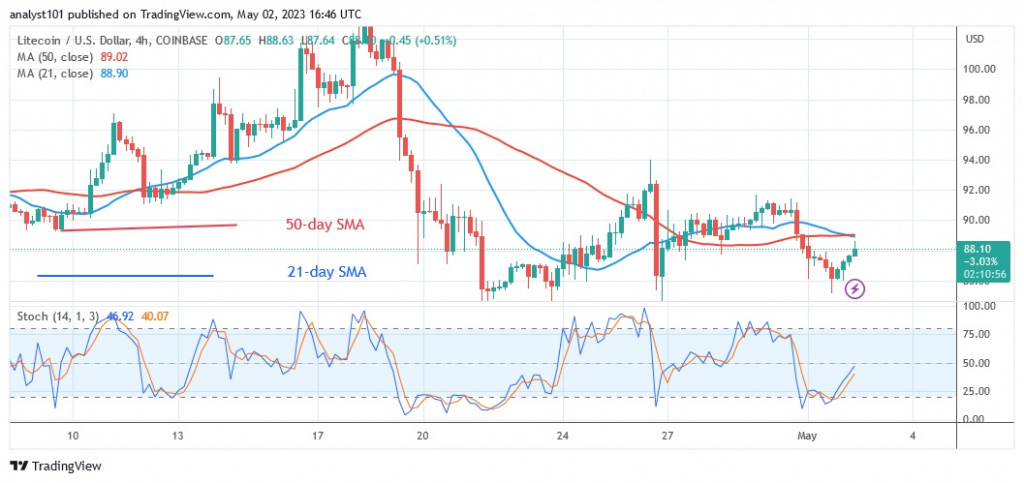
On the Relative Strength Index for the period 14, Litecoin is at level 43. The RSI has not changed in the last week. The altcoin is in a bearish trend zone and could fall further. Moreover, the current decline is due to the fact that the price bars are below the moving average lines. The daily stochastic is at 40, which means that the cryptocurrency asset is in an uptrend.

Technical indicators
Resistance levels: $140, $180, $220
Support levels: $100, $60, $20
What is the next move for Litecoin?
Litecoin is falling as it approaches the previous low of $84. The altcoin's uptrend is speculative as it is trading in a bearish trend zone. According to the price indication, Litecoin will continue to fall until it reaches a low of $73. During this time, LTC prices are moving between $84 and $92.

Disclaimer. This analysis and forecast are the personal opinions of the author and are not a recommendation to buy or sell cryptocurrency and should not be viewed as an endorsement by CoinIdol. Readers should do their own research before investing in funds.
News
Price
News
Price
Price

(0 comments)