Litecoin Falls In The Face Of Strong Rejection At $89

The price of Litecoin (LTC) is in a sideways trend and is experiencing a price rally. Price analysis of Litecoin by Coinidol.com.
Litecoin price long term prediction: ranging
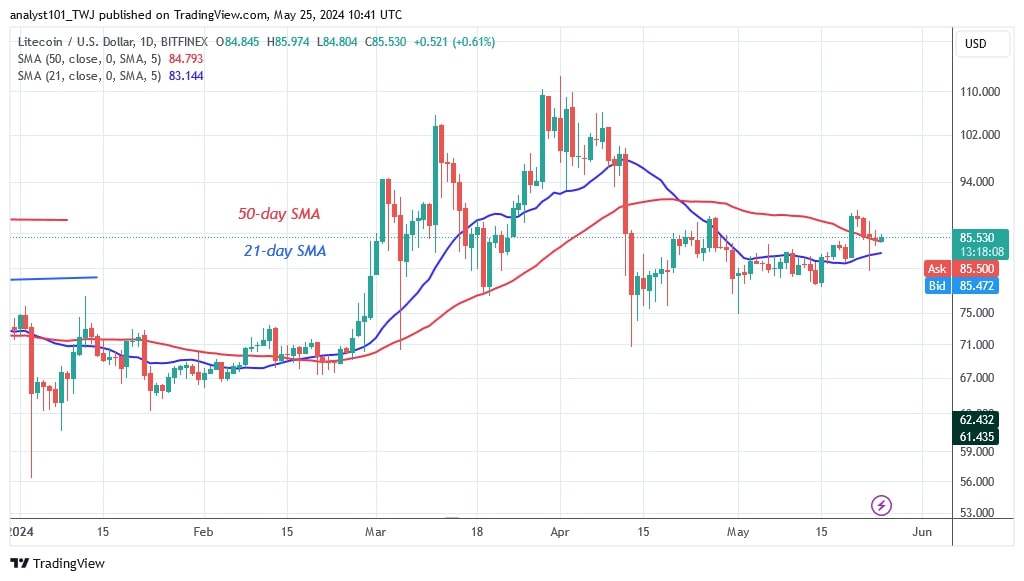
On May 20, the price of the cryptocurrency rose above the moving average lines and reached a high of $89. This is the first time that Litecoin has broken out of the range defined by the $73 support and the moving average lines.
On the upside, the bullish momentum could not be sustained due to the strong rejection at the recent high. However, the LTC price has pulled back above the 50-day SMA, indicating a likely uptrend for the cryptocurrency. For instance, if the altcoin recovers above the 50-day SMA, the $89 resistance level will be breached. The cryptocurrency will return to its previous highs of $94 and $106. However, if the 50-day SMA support is broken by the bears, Litecoin will fall to its current level. The altcoin will also fall to its current support level of $79.
Analysing the Litecoin indicators
The LTC price bars have risen above the moving average lines after a rejection at the $89 high. The altcoin price has retraced above the moving average lines or the 50-day SMA support. Litecoin will rise if the 50-day SMA support holds. The cryptocurrency will return to its trading range if the 50-day SMA support is broken.

What is the next move for Litecoin?
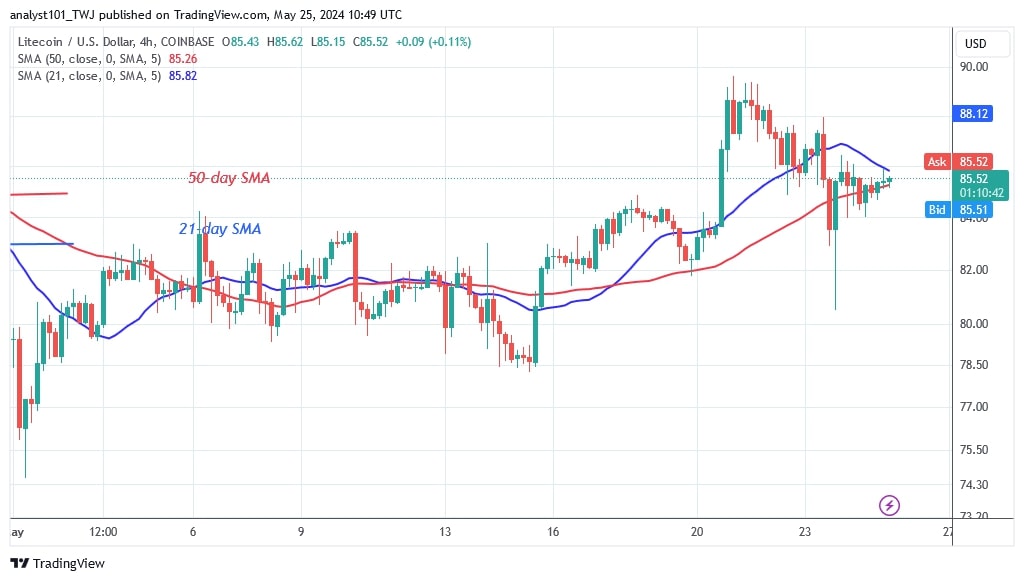
On the 4-hour chart, Litecoin has dropped below the moving average lines. The selling pressure has eased as the price of the cryptocurrency has moved between the moving average lines on the 4-hour chart. If the moving averages are broken, the altcoin will show a trend. The doji candlesticks are present and limit the price fluctuations.

Disclaimer. This analysis and forecast are the personal opinions of the author and are not a recommendation to buy or sell cryptocurrency and should not be viewed as an endorsement by CoinIdol.com. Readers should do their research before investing in funds.
Price
Price
News
Price
Price

(0 comments)