Litecoin in Downward Correction, Fluctuates Between $160 and $200

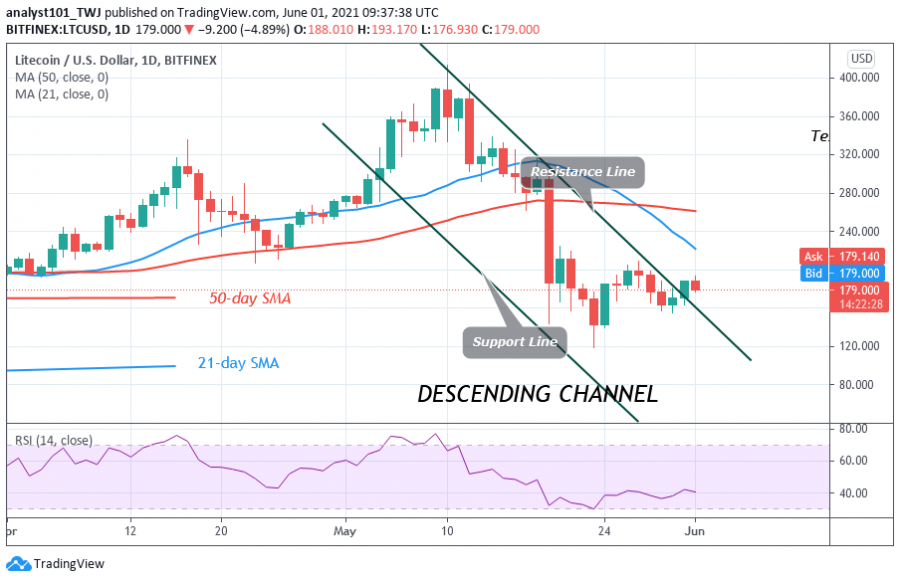
Litecoin (LTC) price is in a downward correction. Today, the crypto turns after reaching the high of $193. With this rejection, the market is likely to decline to $170 low.
Daily, buyers have been retesting the resistance at $200 to break it. As a result, Litecoin's recovery has been threatened at the $200 resistance zone. Buyers have failed to sustain above the resistance zone.
Lack of buying power by the bulls has compelled the altcoin to a sideways move. Presently, LTC/USD is range-bound between $160 and $200. On the downside, if the price breaks below $160 support, the market will decline to the previous low at $118. On the other hand, if buyers overcome the resistance at $200, the crypto will rally to $240 high. In the interim, LTC is in a downward move below the resistance zone.
Litecoin indicator analysis
The 21-day and 50-day SMAs are sloping southward. The crypto has a bearish crossover as the 21-day SMA crosses below the 50-day SMA. LTC is in the downtrend zone at level 40 of the Relative Strength Index period 14. LTC/USD is below the 80% range of the daily stochastic. It indicates that the market is likely to fall.

Technical indicators:
Major Resistance Levels – $500 and $540
Major Support Levels – $340 and $40
What is the next move for Litecoin?
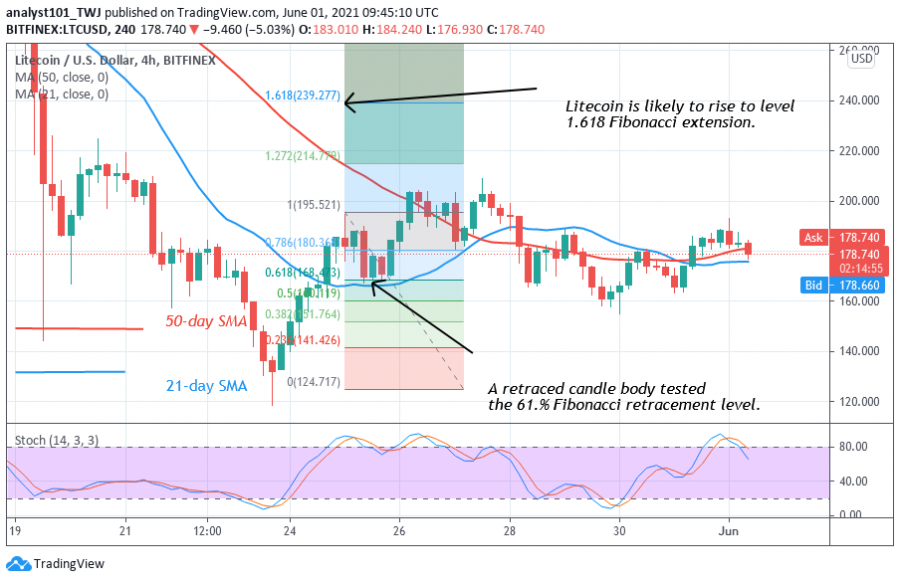
LTC/USD is in a sideways move below the resistance at $200. On May 25 uptrend; a retraced candle body tested the 61.8% Fibonacci retracement level. This retracement indicates that the market will rise to level 1.618 Fibonacci extensions or level $239.27. From the price action, the Fibonacci level will be attained if the current resistance is breached.

Disclaimer. This analysis and forecast are the personal opinions of the author are not a recommendation to buy or sell cryptocurrency and should not be viewed as an endorsement by CoinIdol. Readers should do their own research before investing funds.
Coin expert
Price
Price
Price
News

(0 comments)