Litecoin Continues Upward Movement And Bounces Back Above $71
Updated: Dec 27, 2023 at 14:18

The price of Litecoin (LTC) was able to hold reasonably steady thanks to the doji candlesticks. Litecoin price analysis by Coinidol.com.
Long-term forecast for the Litecoin price: bearish
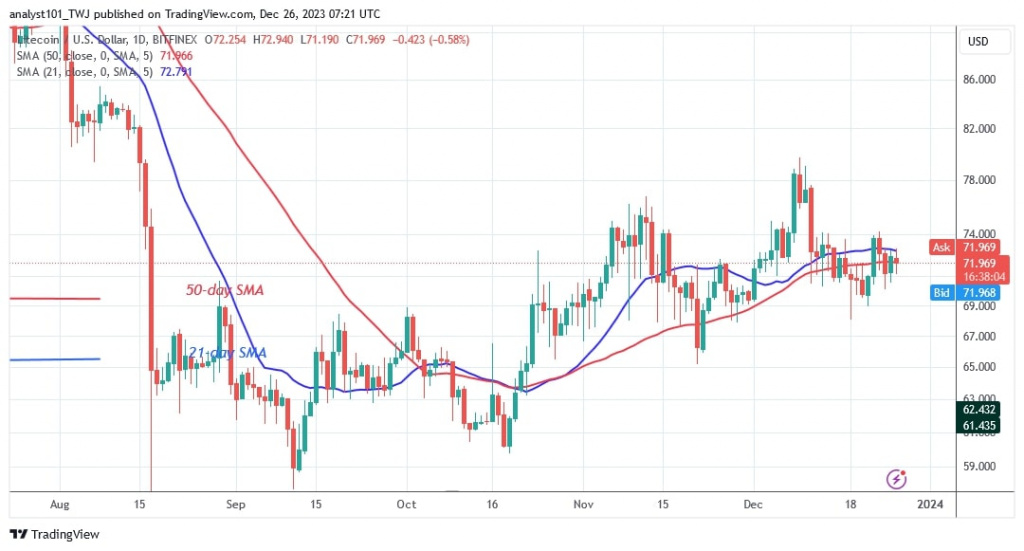
The price of the cryptocurrency has remained steady at $72. Moreover, Litecoin is trading above the moving average lines.
If the price of the cryptocurrency holds above the 21-day simple moving average on December 26 and 27, the market will resume its fluctuations and retest the previous resistance level of $79. The price will fall below the 50-day SMA and the current support at $70 if it breaks below the 21-day SMA.
Beyond that, Litecoin will return to its previous price range of $60 to $70. Buyers will try to keep the price above the moving average lines.
Analysis of Litecoin indicators
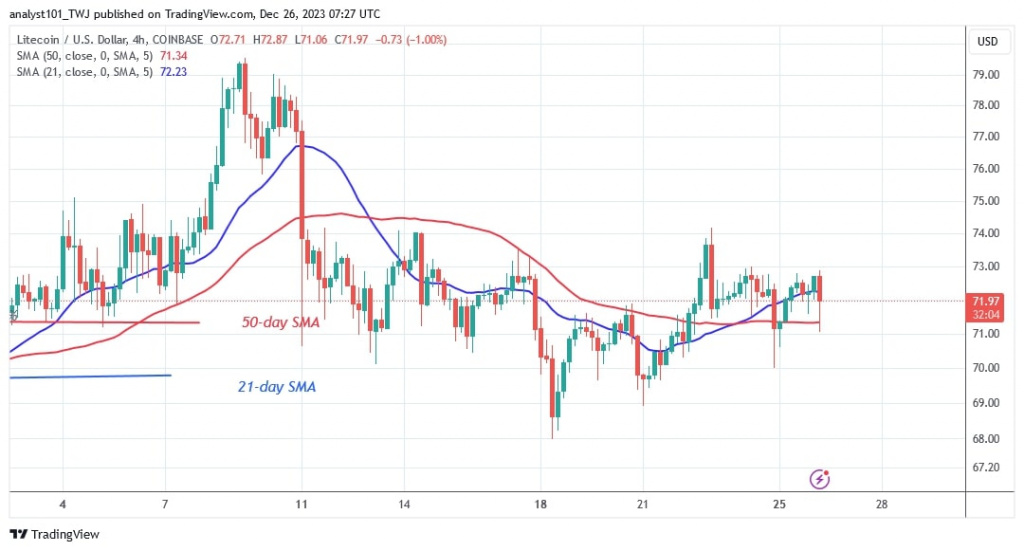
Litecoin is falling as the bears have broken below the 21-day simple moving average line. If the moving average lines are broken, Litecoin will enter the bearish trend zone. The bulls have bought the dips as the altcoin resumes its uptrend. Prices on the 4-hour chart are between the moving average lines, indicating a likely sideways movement for the cryptocurrency.
Technical indicators
Resistance levels: $100, $120, $140
Support levels: $60, $40, $20

What's the next move for Litecoin
After the price drop on December 23, Litecoin traded between $71 and $74. The price of the cryptocurrency fell and then recovered. If the altcoin returns above the 21-day $MA, it will resume its uptrend.
December 19, the bearish momentum fell below the moving average lines, leading to a low of $68. The bulls bought the dips as Litecoin hit a high of $71, as Coinidol.com reported.

Disclaimer. This analysis and forecast are the personal opinions of the author and are not a recommendation to buy or sell cryptocurrency and should not be viewed as an endorsement by CoinIdol.com. Readers should do the research before investing in funds.
Price
Price
Price
News
Price

(0 comments)