Litecoin Bulls Struggle Below $52 High, May Slide Below $49 Low
Updated: Jul 05, 2022 at 12:21

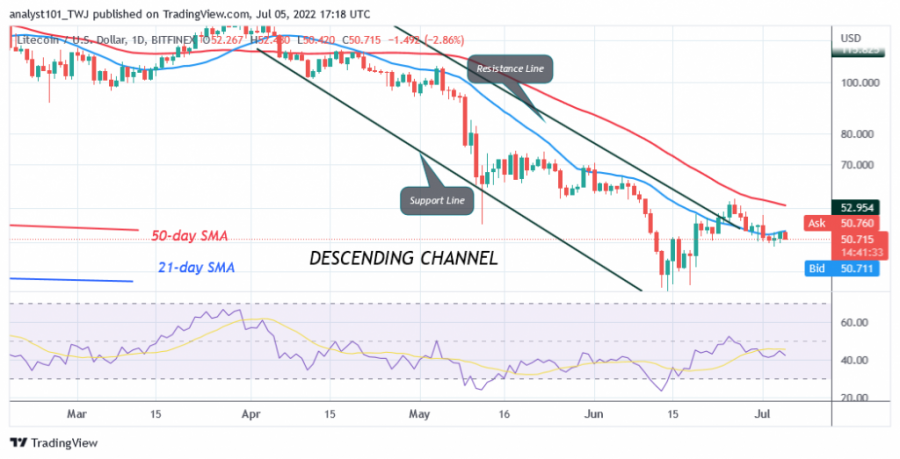
Litecoin (LTC) price is in a downward correction as it breaks below the moving average lines. The cryptocurrency has fallen to a low of $50 at the time of writing.
Since June 26, the LTC price has steadily fallen from its high of $60. On June 26, the bulls were unable to break through resistance at $60, hence the decline.
The altcoin dropped to a low of $49 and then started to rise again. The uptrend was ended by the 21-day line SMA. In other words, further upward movement is doubtful. If the bears break the current support, the market will fall back to the previous low of $44 or $41. In the meantime, LTC/USD has fallen to the low of $49 at the time of writing.
Litecoin indicator analysis
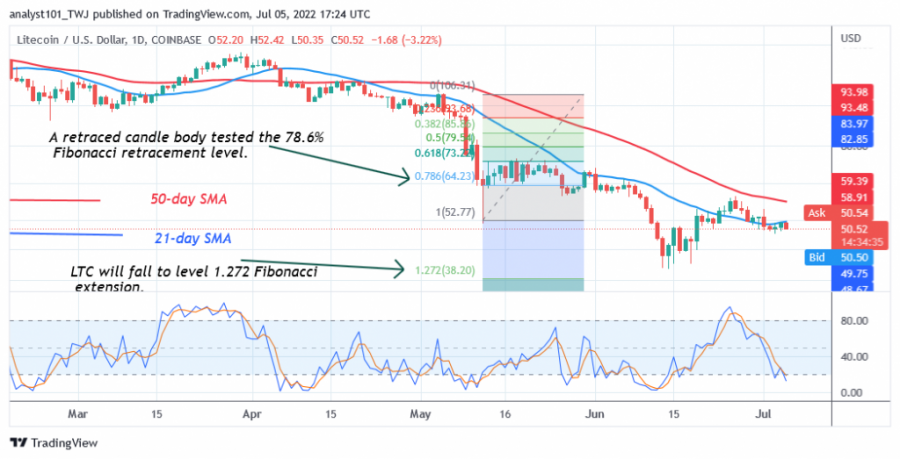
Litecoin has fallen to level 41 on the Relative Strength Index for period 14. The LTC price is in the downtrend zone and is vulnerable to further decline. The cryptocurrency price is below the moving average lines, which indicates a further decline. Litecoin price is below the 20% area of the daily stochastic. This indicates that the market is approaching the oversold area. Buyers are likely to be attracted to the oversold region. The 21-day line SMA and the 50-day line SMA are sloping downwards, indicating a downtrend.

Technical Indicators:
Resistance Levels: $140, $180, $220
Support Levels: $100, $60, $20
What is the next move for Litecoin?
On June 13, Litecoin fell to a low of $40 as bulls bought the dips. The buyers were slowed down by the 21-day line SMA. The altcoin could retake the previous low at $40 if buyers fail to break the recent high. Meanwhile, Litecoin has reached the oversold zone of the market.

Disclaimer. This analysis and forecast are the personal opinions of the author and are not a recommendation to buy or sell cryptocurrency and should not be viewed as an endorsement by CoinIdol. Readers should do their own research before investing funds.
Price
Price
Price
Price
News

(0 comments)