Litecoin Plunges to an Oversold Region as It Rebounds above $100 Low

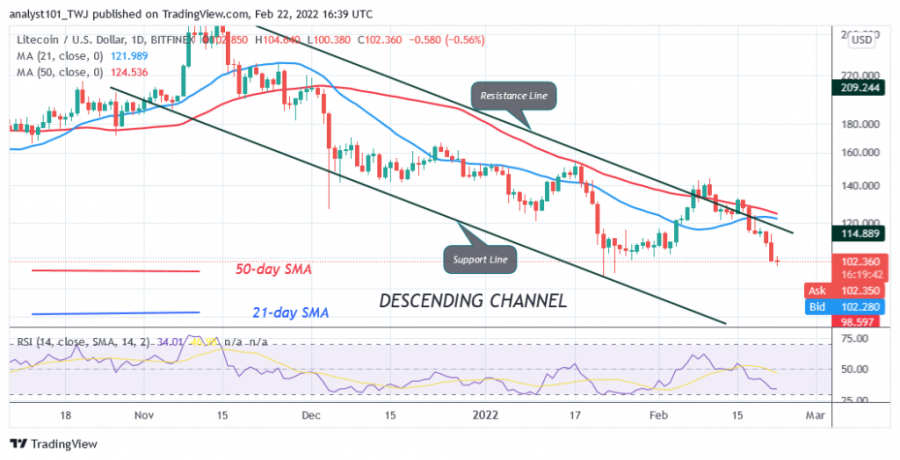
The price of Litecoin (LTC) has fallen below the moving averages as it fell to a low of $102. The bulls' attempt to keep the price above the moving averages failed as the altcoin experienced two rejections at the recent high.
The cryptocurrency's upside moves were rejected at the $144 and $131 highs. The altcoin has fallen into the oversold zone of the market.
The bulls will buy the dips every time the market falls into this area. There are candlesticks with long tails sticking out towards the current support. The candlesticks indicate that there is strong buying pressure at the current support. Nonetheless, the current support has been holding above $100 since the January 22 price collapse. At the time of writing, Litecoin is trading at $102. Litecoin could resume its upward movement.
Litecoin indicator analysis
LTC price bars are below the moving averages, indicating a possible downward movement. The altcoin is below the 20% area of the daily stochastic. This indicates the oversold area of the market. Litecoin is at level 34 of the Relative Strength Index for period 14, indicating that the cryptocurrency is approaching the oversold region of the market.

Technical Indicators:
Resistance Levels: $240, $280, $320
Support Levels: $200, $160, $120
What is the next move for Litecoin?
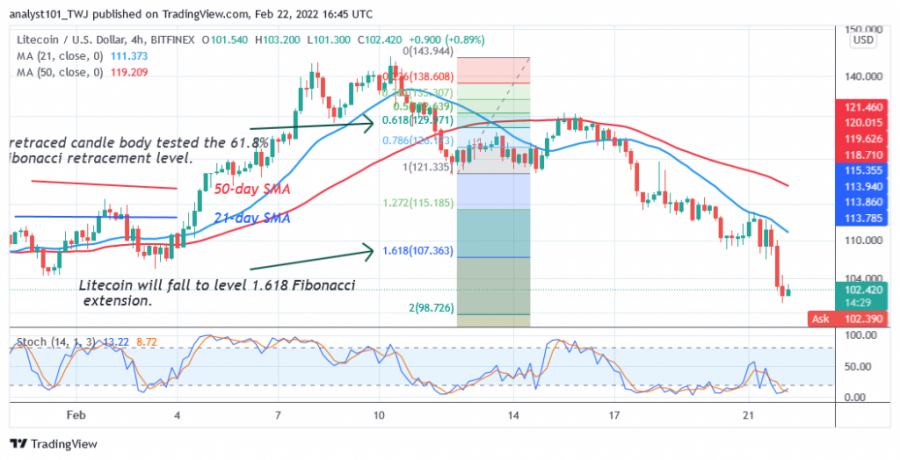
Litecoin has been in a downtrend. Selling pressure has resumed as the altcoin is rejected at the 21-day moving average line. Meanwhile, the downtrend from February 12 has shown a candle body testing the 61.8% Fibonacci retracement level. The retracement suggests that Litecoin will fall to the Fibonacci extension level of 1.618 or the low of $107.36. The price action shows that Litecoin is fluctuating below the 1.618 Fibonacci extension.

Disclaimer. This analysis and forecast are the personal opinions of the author and are not a recommendation to buy or sell cryptocurrency and should not be viewed as an endorsement by CoinIdol. Readers should do their own research before investing funds.
News
Price
Coin expert
News
Coin expert

(0 comments)