Chainlink Breaches Crucial Overhead Resistance at $35, Resume Up Trending

Chainlink (LINK) price analysis shows the new uptrend was also interrupted at the $44 high.
Chainlink (LINK) price Long-term Analysis: Bullish
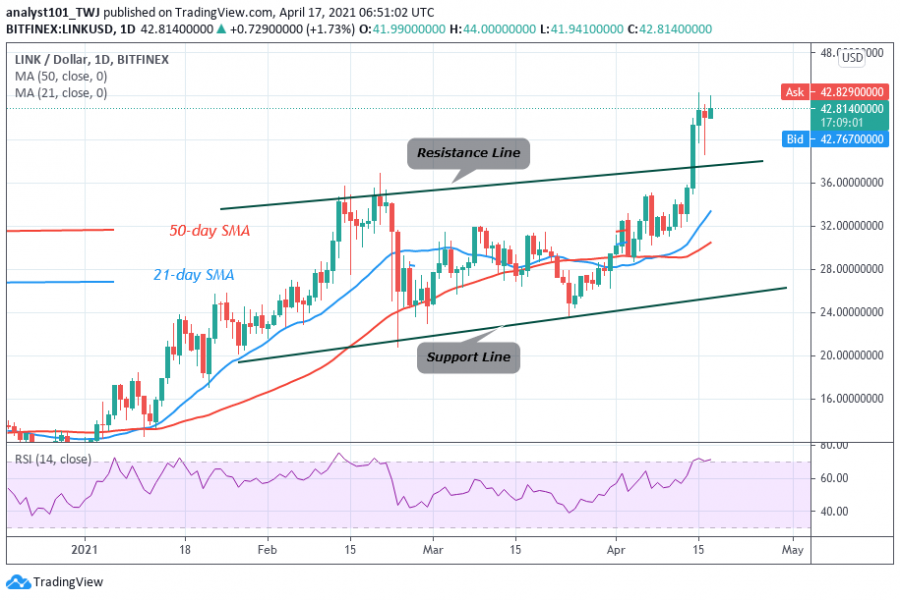
Buyers made a pullback to retest the recent high which also faces another rejection. On the upside, if buyers breach the recent high, the market will rise to $50 high. On the other hand, if buyers fail to break the recent high, LINK will fall to $38 low and resume a range-bound move. Meanwhile, LINK/USD is trading at $42.91 at the time of writing.
On April 14, LINK rebounded above $32 support as bulls break the $35 overhead resistance. This signals the resumption of an uptrend that has been interrupted since February 13. The altcoin rallied to a high of $44 after the breakout at the $35 overhead resistance.
Chainlink (LINK) Indicator Reading
LINK is at level 71 of the Relative Strength Index period 14. It indicates that the market has reached the overbought region. Perhaps, the altcoin has no enough room to rally on the upside. The 21-day and 50-day SMAs are sloping upward indicating the uptrend. Chainlink has a bullish crossover where the 21-day SMA crosses above the 50-day SMA. This gives a buy signal.

Technical indicators:
Major Resistance Levels – $45 and $50
Major Support Levels – $25 and $20
What Is the Next Move for Chainlink (LINK)?
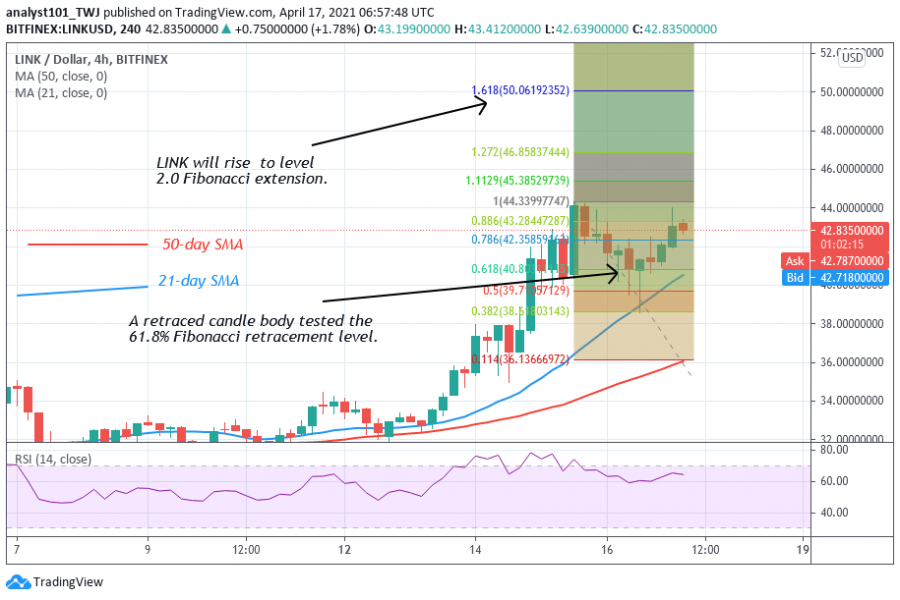
LINK has resumed an uptrend after breaking the overhead resistance. There is a possibility of further upsides. Meanwhile, a retraced candle body tested the 61.8% Fibonacci retracement level. This retracement indicates that the market will rise to level 1.618 Fibonacci extensions or the high of $50.06. From the price action, buyers are struggling to break the $44 resistance.

Disclaimer. This analysis and forecast are the personal opinions of the author are not a recommendation to buy or sell cryptocurrency and should not be viewed as an endorsement by Coin Idol. Readers should do their own research before investing funds.
Price
Price
Price
Price
Price

(0 comments)